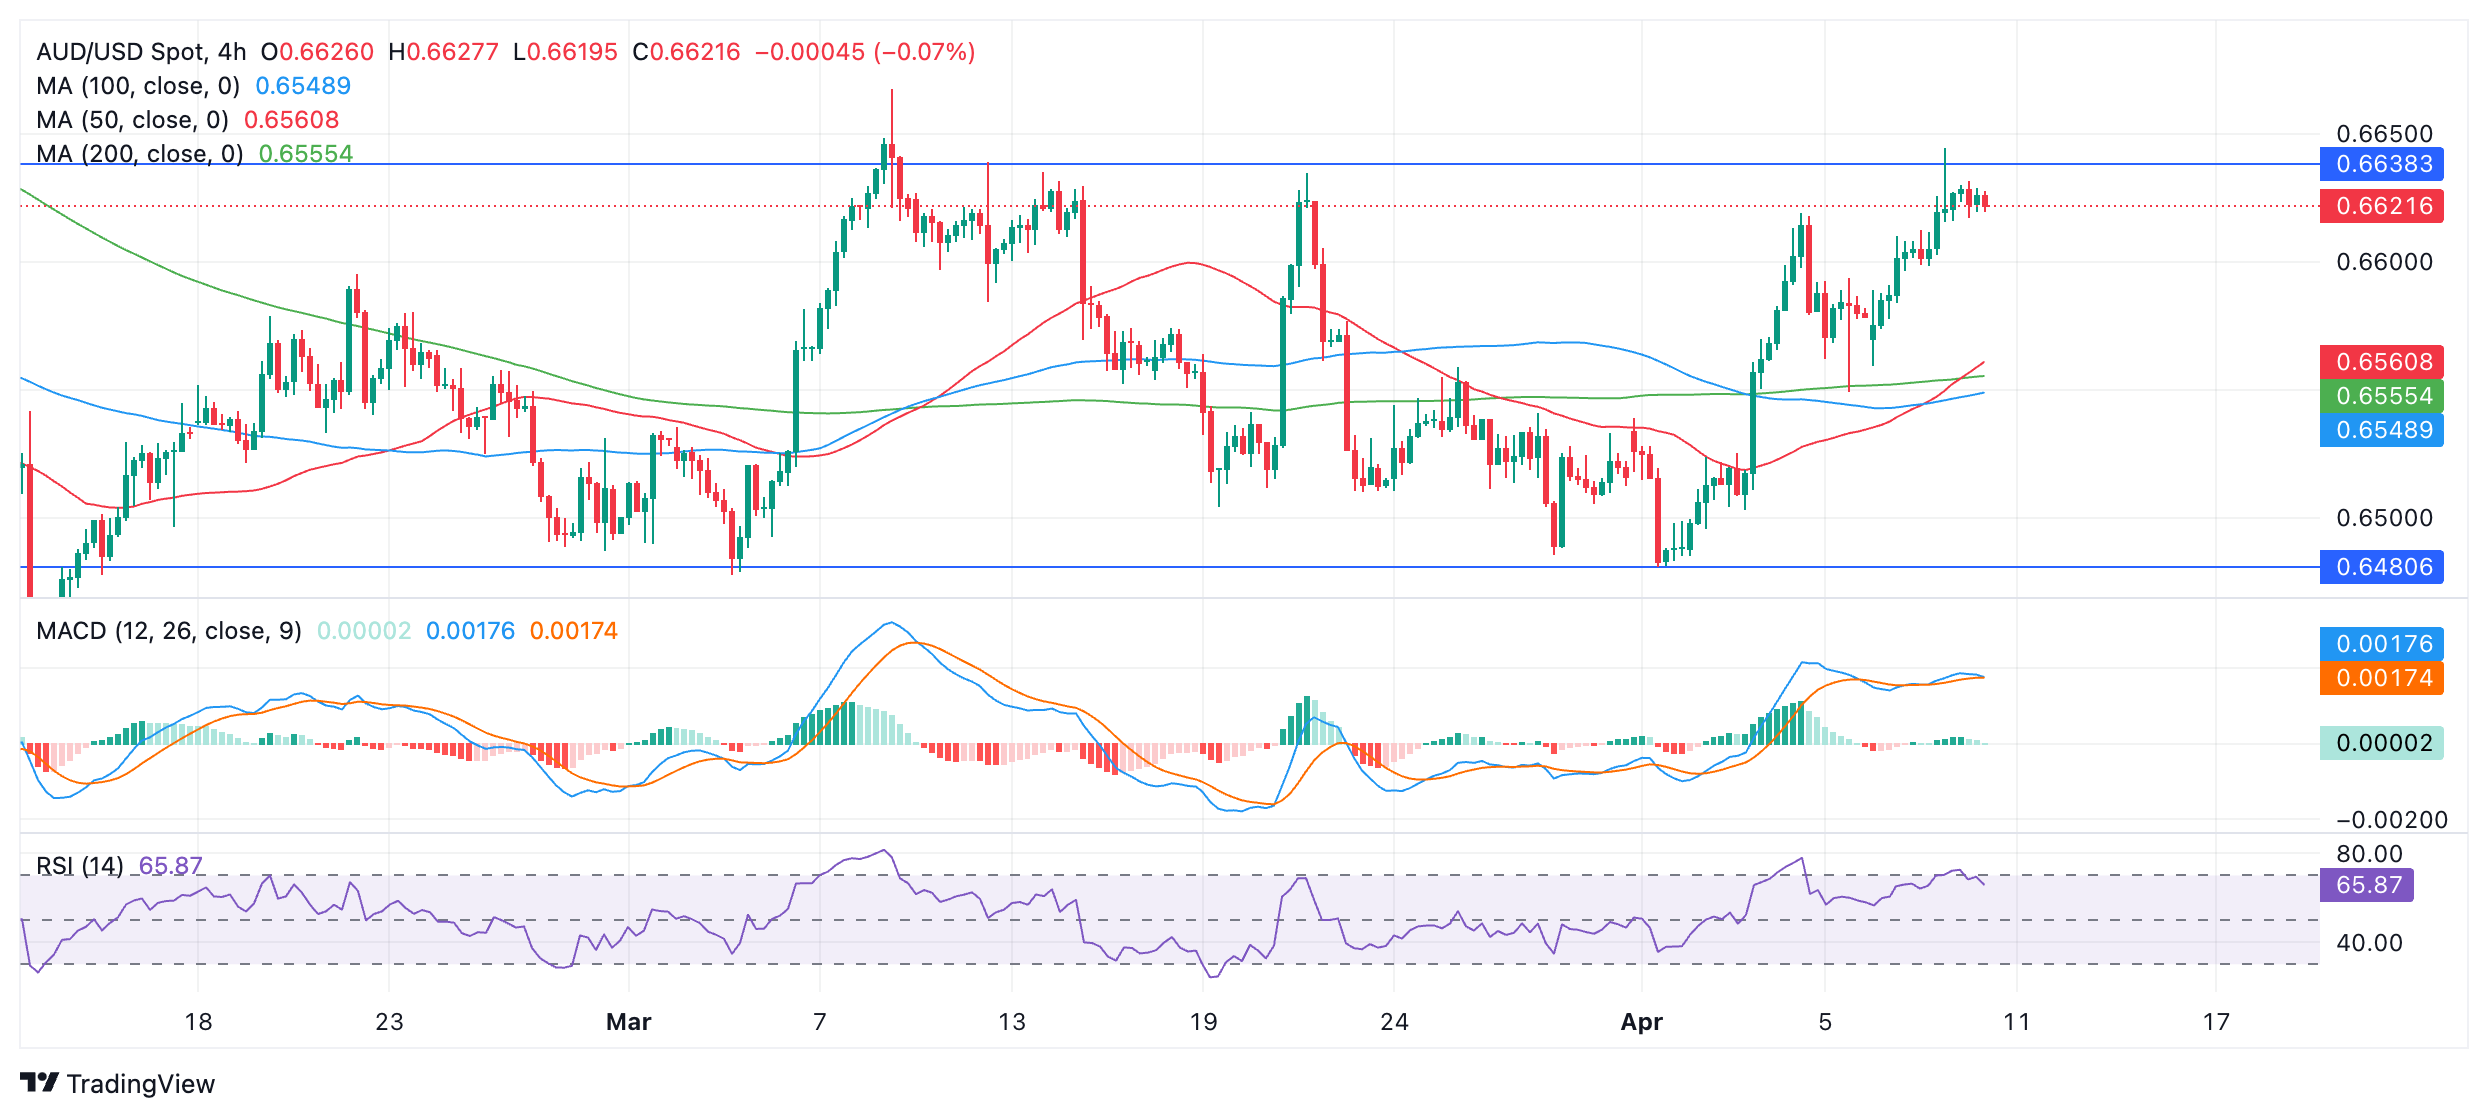
- AUD/USD has entered into a sideways range on the short-term charts.
- The pair has just formed a bearish candlestick at the range highs and is looking poised to weaken.
- A move back down is possible towards the range lows at 0.6420.
AUD/USD is trading in the 0.6620s on Wednesday, ahead of key US data. The pair has entered a sideways trend on the 4-hour chart which is used to assess the direction of the short-term trend.
AUD/USD 4-hour Chart

At the beginning of April price touched the bottom of the range low at 0.6480 and bounced. After that it started climbing back up to the top of the range.
On Tuesday AUD/USD formed a bearish Shooting Star candlestick pattern at the top of the range in the 0.6640s. Although the following bar was green and therefore did not confirm the Shooting Star, it was nevertheless a negative sign. The pair has since been trading sideways in the 0.6620s.
Given AUD/USD has been rejected at the range high and formed a bearish candlestick pattern at the same time, there is a risk of a reversal, and the price starting to move back down towards the range lows again, continuing the sideways trend.
Both the Moving Average Convergence Divergence (MACD) and Relative Strength Index (RSI) momentum indicators are showing bearish divergence at the April 4 and April 9 peaks. Whereas price rose up and made a higher high between that period, both indicators failed to follow suit, indicating weakness.
RSI has just exited the overbought region which is a further bearish sign. It recommends short-term bullish traders close their long bets and open short positions.
A break below 0.6495 would help provide confirmatory evidence of a new move lower within the range, with a possible target back down at the 0.6420 range lows.
The cluster of major Moving Averages are likely to provide support at around 0.6450, and could slow the pace of the sell-off.
A break above the April high at 0.6645 would negate the bearish view and could indicate a breakout, with an initial target at the 0.6668 March highs.


