- Uniswap price retesting the weekly support at $7.21, finding stability here, could signal a potential rally on the horizon.
- Data from Lookonchain shows that a whale has bought 1.43 million UNI tokens worth $10.3 million.
- On-chain data shows that UNI supply on exchanges is decreasing, suggesting a bullish move.
- A weekly candlestick close below $7.21 would invalidate the bullish thesis.
Uniswap (UNI) price is currently retesting its weekly support at $7.21 and stabilizing, potentially indicating an upcoming rally. According to data from Lookonchain, a whale has purchased 1.43 million UNI tokens valued at $10.3 million. On-chain metrics further reveal a decrease in UNI supply on exchanges, hinting at favorable conditions for a price increase in the near term.
Uniswap Whale buys the dips
According to data from Lookonchain, a whale purchased 1.43 million UNI tokens valued at $10.3 million from the Binance exchange on Wednesday. Subsequently, the whale borrowed $5.5 million in USDC tokens from the Aave protocol and deposited them on Binance, indicating a potential bullish stance on UNI.
Uniswap price shows potential for a rally after finding stability at weekly support level
Uniswap price retested its weekly support level at $7.21 on Thursday. This support area roughly coincides with the ascending trendline drawn from mid-October 2023 to late July 2024, establishing a critical zone of support that should be monitored closely.
If Uniswap finds support at $7.21, it could rally 21% to retest the 61.8% Fibonacci retracement level (plotted from the early June 2023 low of $3.63 to the early March 2024 high of $17.12) at $8.78.
The weekly chart’s Relative Strength Index (RSI) and the Awesome Oscillator have briefly slipped below their neutral levels of 50 and zero. If bulls are indeed making a comeback, then both momentum indicators must maintain their positions above their respective mean levels. Such a development would add a tailwind to the recovery rally.
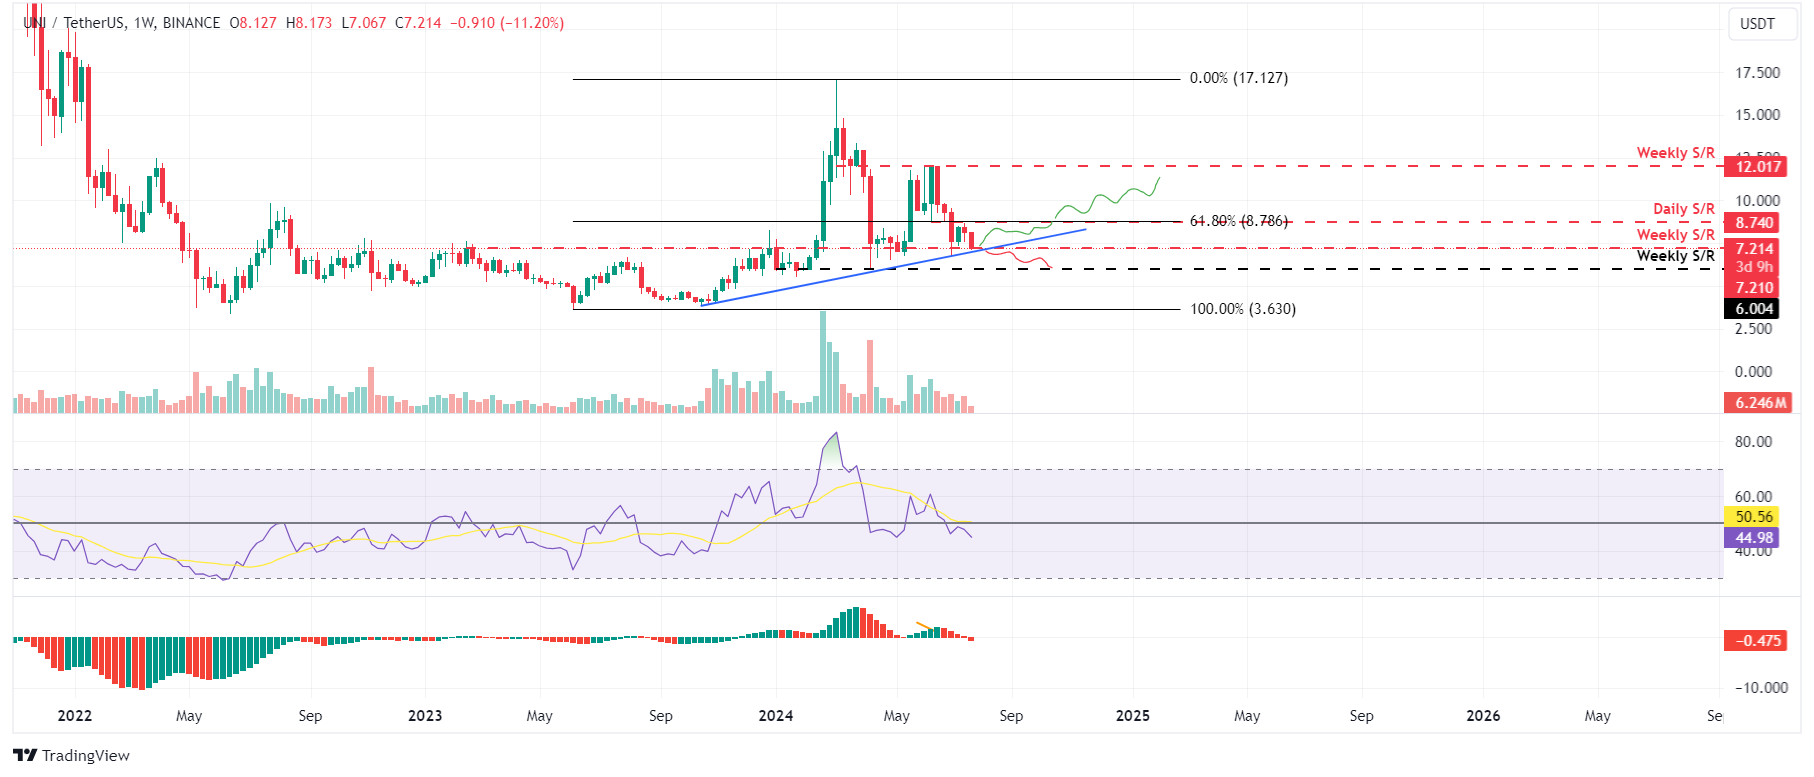
UNI/USDT weekly chart
Santiment’s data on Supply on Exchange illustrates the total amount of UNI tokens held across centralized exchanges (CEX), decentralized exchanges (DEX), and outside exchanges. An increase in this index suggests potential sell-offs or the formation of local price tops, while a decrease indicates whale accumulation or local price bottoms.
In UNI’s case, the Supply on Exchange decreased from 70.81 million on July 24 to 69.19 million on July 25. This 2.28% drop in supply suggests that investors are accumulating and reducing the selling pressure, signaling a bullish outlook.
%20%5B21.18.52,%2025%20Jul,%202024%5D-638575254633443409.png)
UNI Supply on Exchanges chart
Conversely, if UNI’s weekly candlestick price closes below $7.21 and breaks below the ascending trendline, it would produce a lower low and signal a break in the market structure. This move would invalidate the bullish thesis, potentially triggering a 16% crash to the next weekly support level of $6.00.