


- Cardano and Solana prices continue to trade in red on Monday after falling over 15% the previous week.
- Coinglass data shows that ADA and SOL liquidated a total of $120 million in the last 24 hours.
- Technical outlook and on-chain metrics for both altcoins suggest a continuing bearish trend.
Cardano (ADA) and Solana (SOL) prices continue to trade in red on Monday after falling over 15% the previous week. On Saturday, the implementation of the United States (US) President Donald Trump’s announced tariffs on major trading partners, including China, Canada, and Mexico, exerted some selling pressure on the overall crypto market.
The recent downturn at the start of this week has liquidated over $120 million from ADA and SOL in the last 24 hours. Both altcoins’ technical outlook and on-chain metrics suggest a continuing bearish trend.
Cardano and Solana traders face massive wipeout over $120 million
The crypto market began a correction on Friday as Bitcoin dropped below a key support level, continuing its decline through the weekend. By Sunday, altcoins like Cardano and Solana had followed BTC’s lead, falling nearly 16% last week and extending their correction into the new week.
ADA and SOL correction on Monday triggered a wave of liquidations, resulting in over $120 million in total liquidations and more than $84 million, specifically in SOL, according to data from CoinGlass. Huge liquidations like this could spark Fear, Uncertainty and Doubt (FUD) among these altcoin investors and could cause a rise in selling pressure, leading to further decline in its prices.
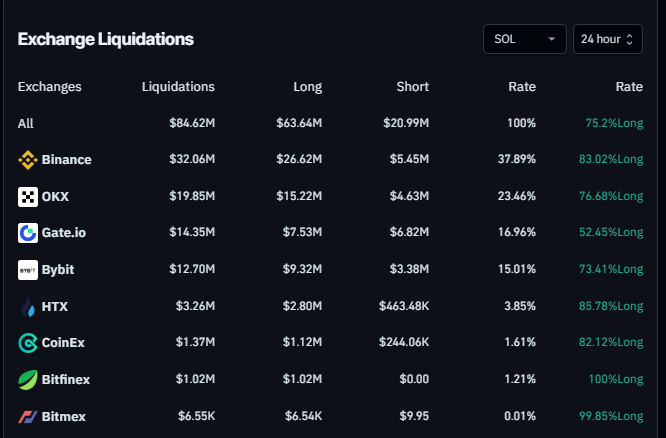
SOL Liquidation chart. Source: Coinglass
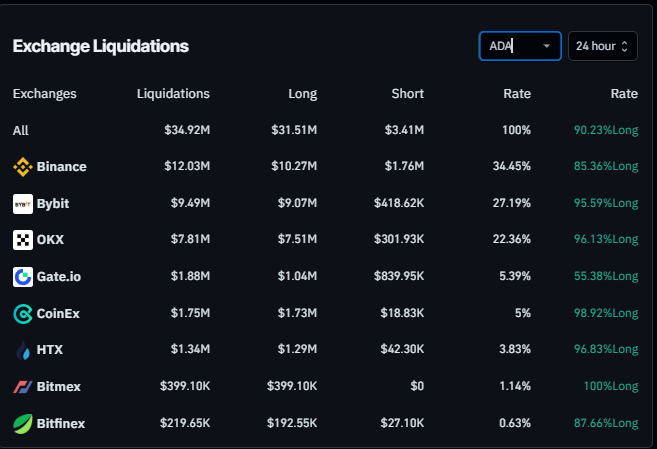
ADA Liquidation chart. Source: Coinglass
On-chain metrics show bearish signs
According to Coinglass’s OI-Weighted Funding Rate data, the number of traders betting that the prices of altcoins Cardano and Solana will slide further is higher than that anticipating their price to increase.
This index is based on the yields of futures contracts, which are weighted by their open interest rates. Generally, a positive rate (longs pay shorts) indicates bullish sentiment, while negative numbers (shorts pay longs) indicate bearishness.
In the case of Cardano and Solana, this metric stands at -0.0058% and -0.0017%, respectively, reflecting a negative rate and indicating that shorts are paying longs. This scenario often signifies bearish sentiment in the market, suggesting potential downward pressure on Cardano and Solana prices.
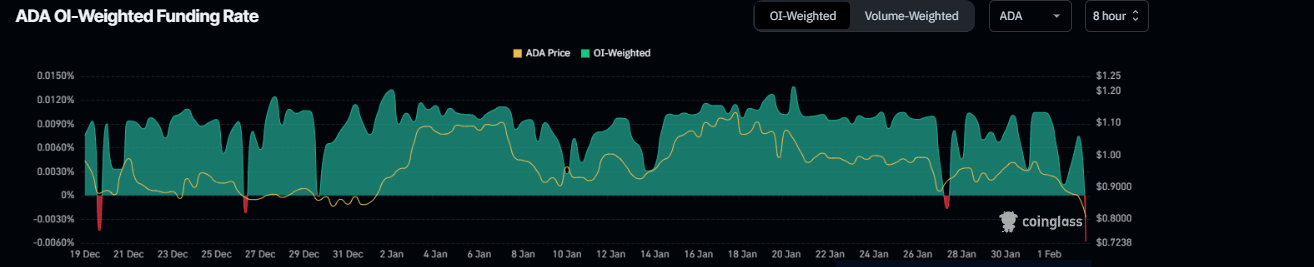
ADA funding rate chart. Source: Coinglass
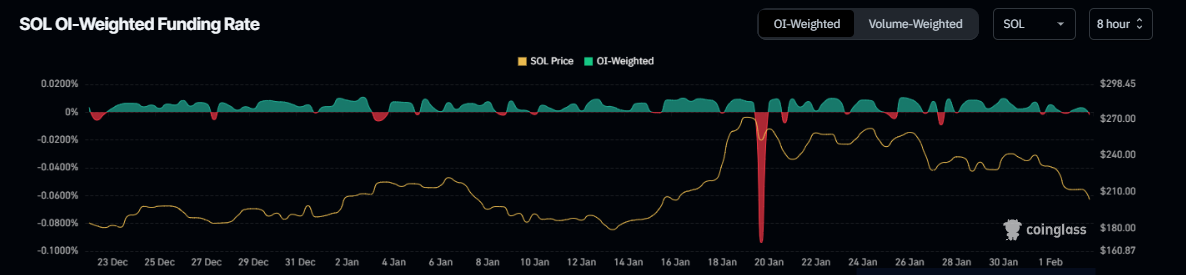
SOL funding rate chart. Source: Coinglass
Cardano Price Forecast: Bears take the lead
Cardano’s price faced rejection around its weekly resistance level of $1.18 on January 17, declining nearly 19% in the next two weeks. As of Monday, it continues to decline by 21.63%, around $0.63 at the time of writing.
If ADA continues correcting, it could extend the decline to test its next weekly support at $0.44.
The Relative Strength Index (RSI) indicator on the weekly chart reads 45, below its neutral level of 50 and points downwards, indicating bearish momentum. Additionally, the Moving Average Convergence Divergence (MACD) shows a bearish crossover, suggesting a downward trend.
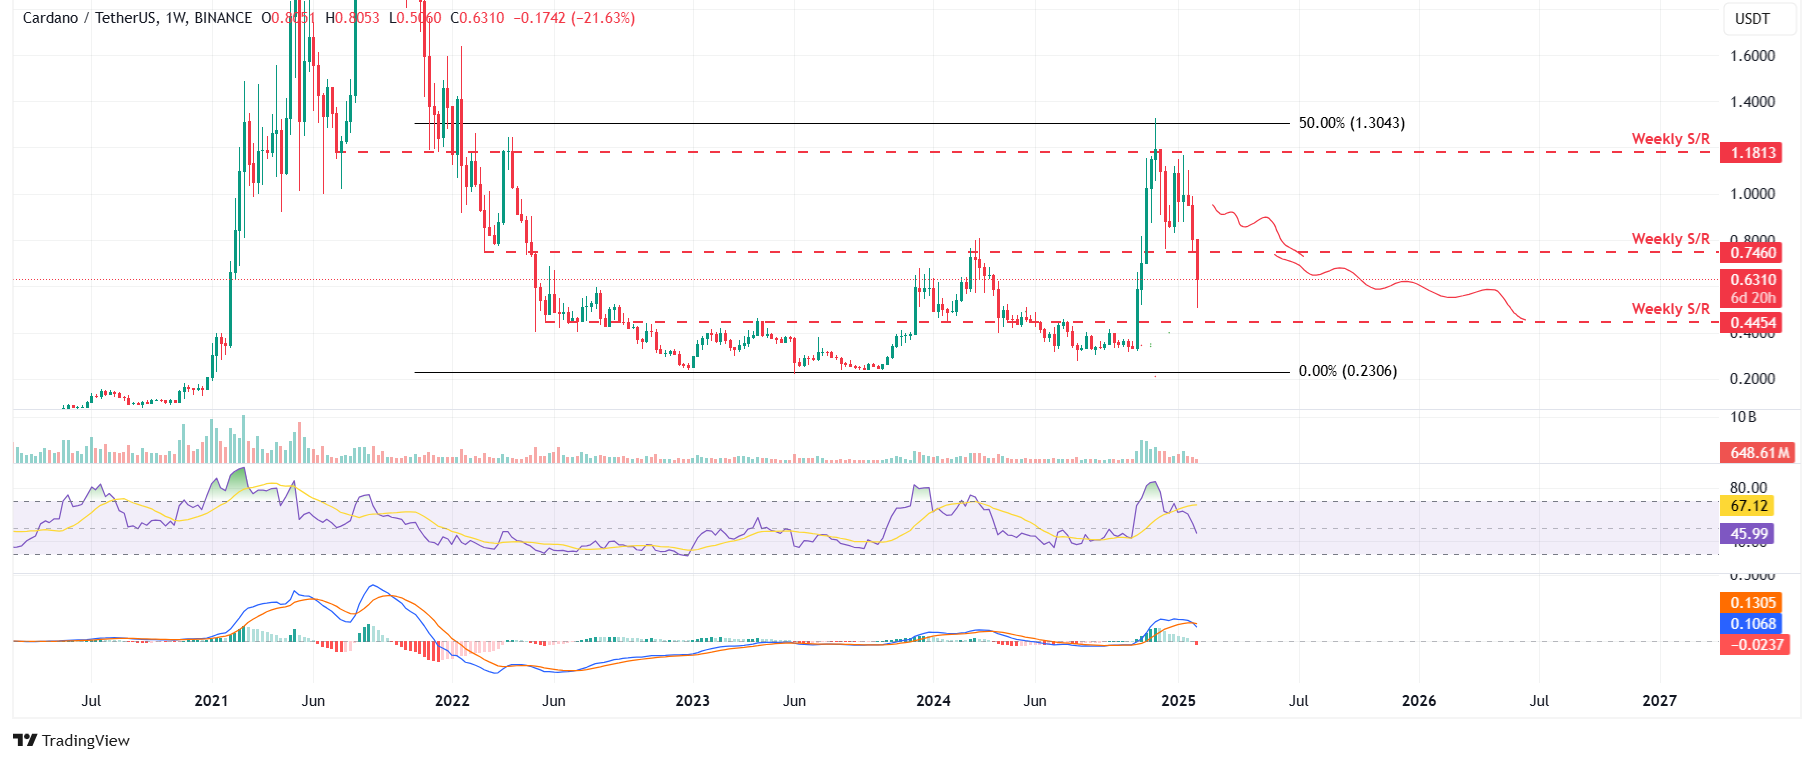
ADA/USDT weekly chart
Solana Price Forecast: Bears aim for $120 mark
Solana’s price declined 15.38% and closed below the 50% price retracement level at $192.20 (drawn from the November 4 low of $155.11 to the November 22 all-time high of $264.39) last week. At the time of writing on Monday, it continues to trade down by 6.34%, around $190.61.
If SOL continues its decline, it could extend to test the January 13 low of $168.88. A successful close below this level would extend an additional decline to test its next weekly support at $120.91.
The RSI indicator on the weekly chart reads 49, below its neutral level of 50 and points downwards, indicating bearish momentum. The MACD also shows a bearish crossover, suggesting a downward trend.
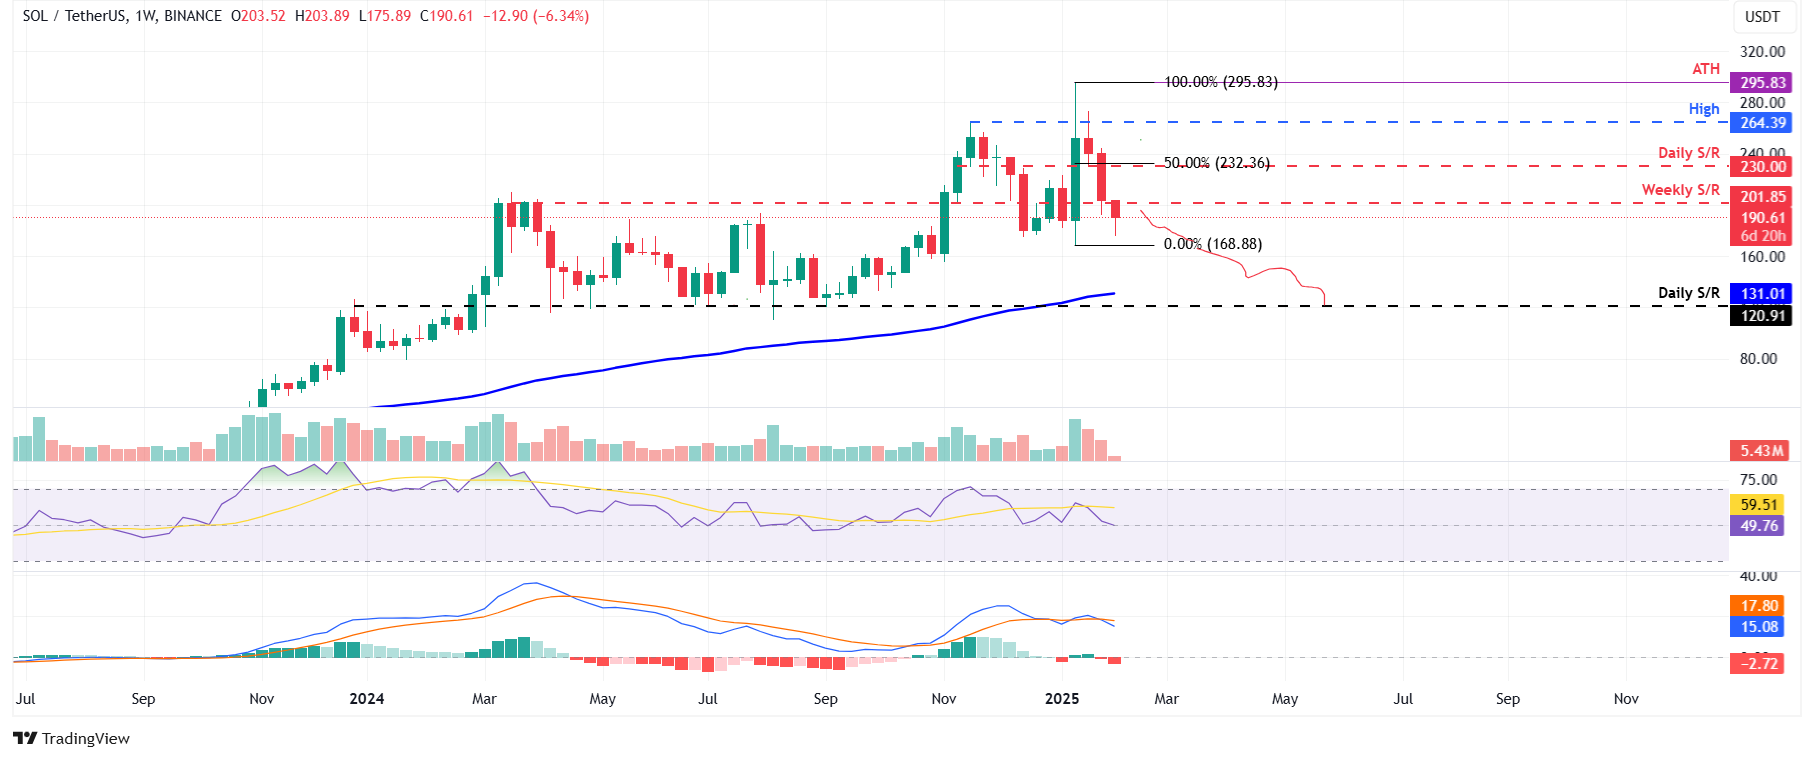
SOL/USDT weekly chart