


- Dogecoin and Shiba Inu prices continue to edge down on Tuesday after falling more than 10% on the previous day.
- These dog theme-based memecoins liquidated a total of $108 million leverage traders in 24 hours.
- The technical outlook suggests the continuation of the downturn, as both memcoins momentum indicators show a bearish trend.
Dogecoin (DOGE) and Shiba Inu (SHIB) prices continue to edge down on Tuesday after falling more than 10% on Monday. The recent downturn at the start of this week has liquidated over $108 million from these dog theme-based memecoins in the last 24 hours. The technical outlook suggests the continuation of the downturn, as both memcoins momentum indicators show a bearish trend.
Dog memecoins traders face massive wipeout
The overall crypto market saw a pullback on Monday at the start of this week after surging since early November. This pullback could be a healthy correction after the altcoin market performed a weekly close above $1.6 trillion for the first time since 2021.
The dog theme-based memecoins DOGE and SHIB also declined double-digits on Monday, triggering a wave of liquidations, resulting in over $108 million in total liquidations and more than $96 million specifically in DOGE, according to data from CoinGlass.
Huge Liquidations like this could spark Fear, Uncertainty and Doubt (FUD) among the dog theme-based memecoins investors and could cause a rise in selling pressure, leading to further decline in its prices.
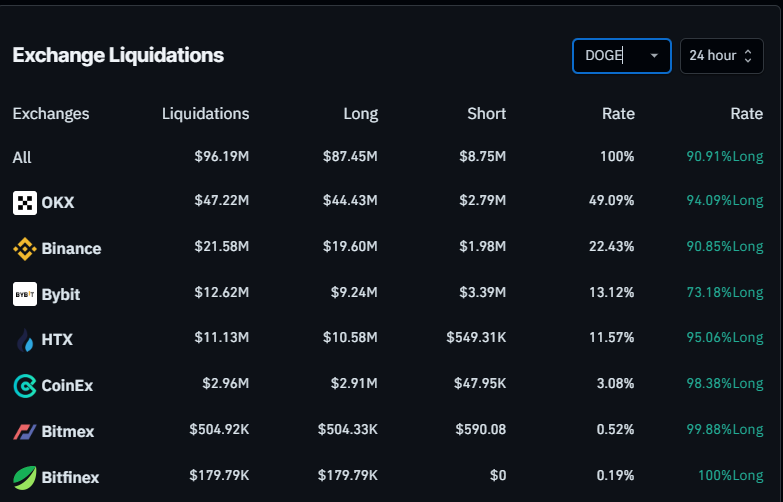
DOGE Liquidation chart. Source: Coinglass
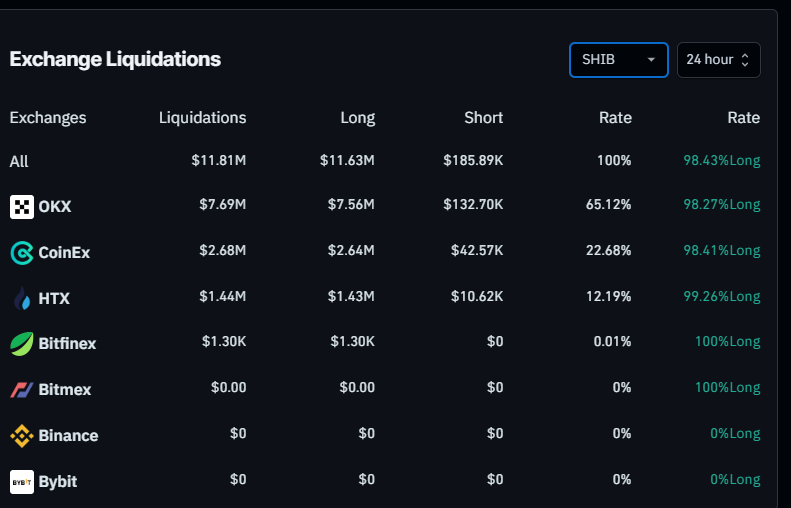
SHIB Liquidation chart. Source: Coinglass
Dogecoin Price Forecast: Declines toward the $0.340 support level
Dogecoin price reached a new yearly high of $0.483 on Sunday after rallying more than 200% since early November. Such a massive rally leads to a pullback. DOGE’s price faced a pullback on Monday, declining more than 11%. At the time of writing on Tuesday, it continues to edge down, trading around $0.400.
The Relative Strength Index (RSI) flashes warning signs. The higher high formed on Sunday does not reflect the RSI chart for the same period, indicating a formation of a bearish divergence, which often leads to a short-term correction.
The daily chart’s Moving Average Convergence Divergence (MACD) indicator also supports the price decline. The MACD line shows a bearish crossover on November 26, indicating sell signals.
If DOGE continues to decline, it could extend the decline to retest its important support level at $0.340.
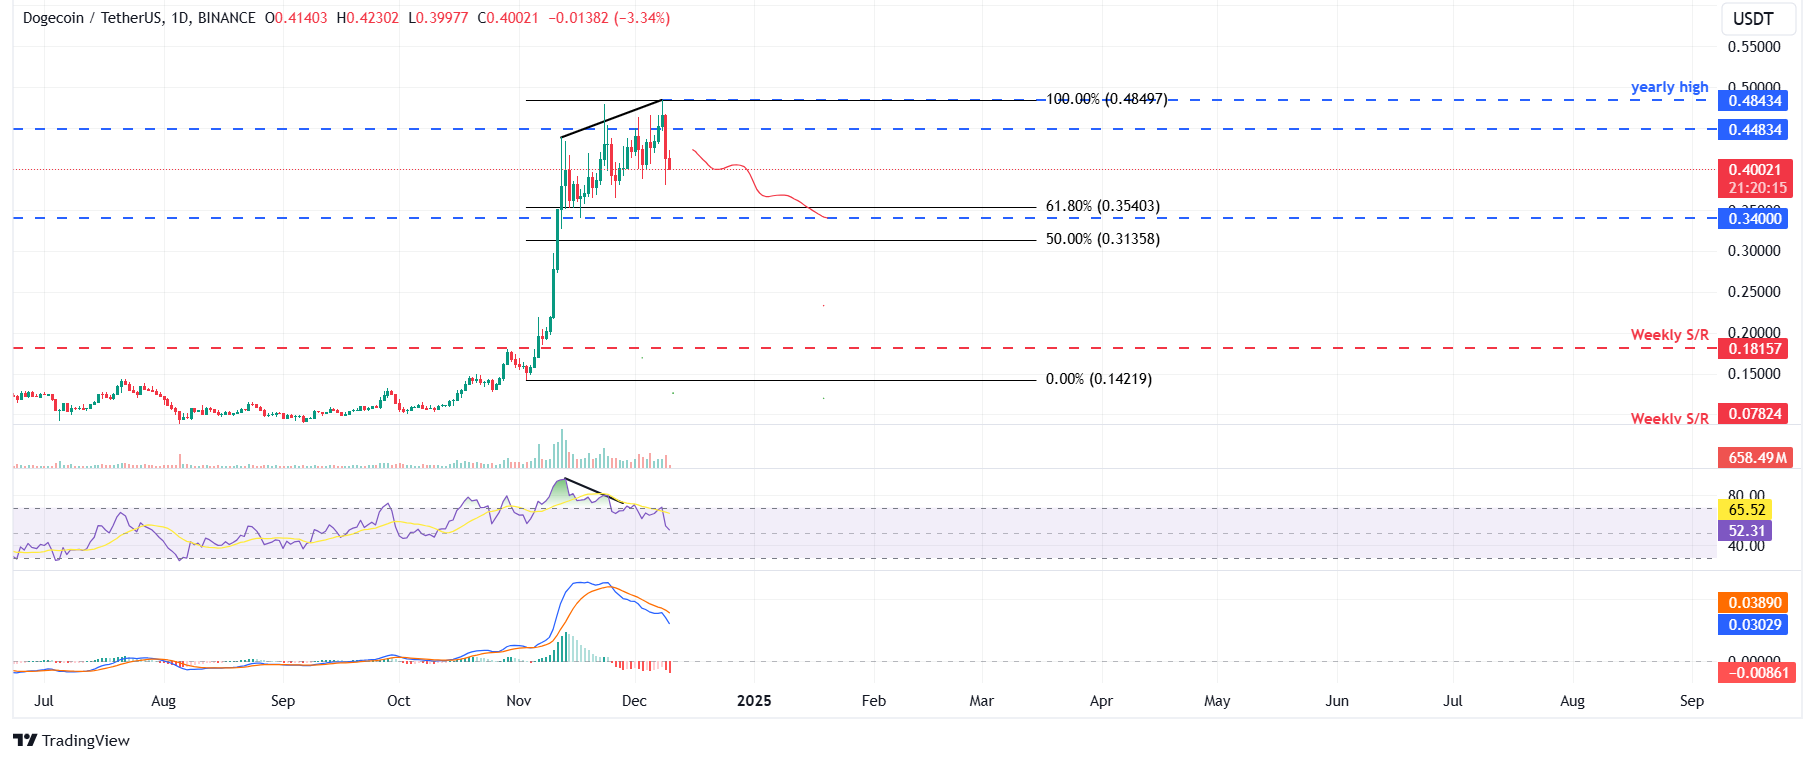
DOGE/USDT daily chart
Shiba Inu Price Forecast: Closes below the weekly support
Shiba Inu price rallied over 4.3% last week, but on Monday, it declined 15.35%, closing below its weekly support at $0.000028. At the time of writing on Tuesday, it continues to decline, trading around $0.000026.
Just like DOGE, SHIB also shows a formation of bearish divergence on the RSI indicator, suggesting a decline ahead. Moreover, the MACD line shows a bearish crossover on Monday, adding more credence to a bearish outlook.
If the weekly level at $0.000028 holds as resistance, it could extend the decline to retest its 50% price retracement level (drawn from the early August low of $0.000010 to December’s high of $0.000033) at $0.000022.
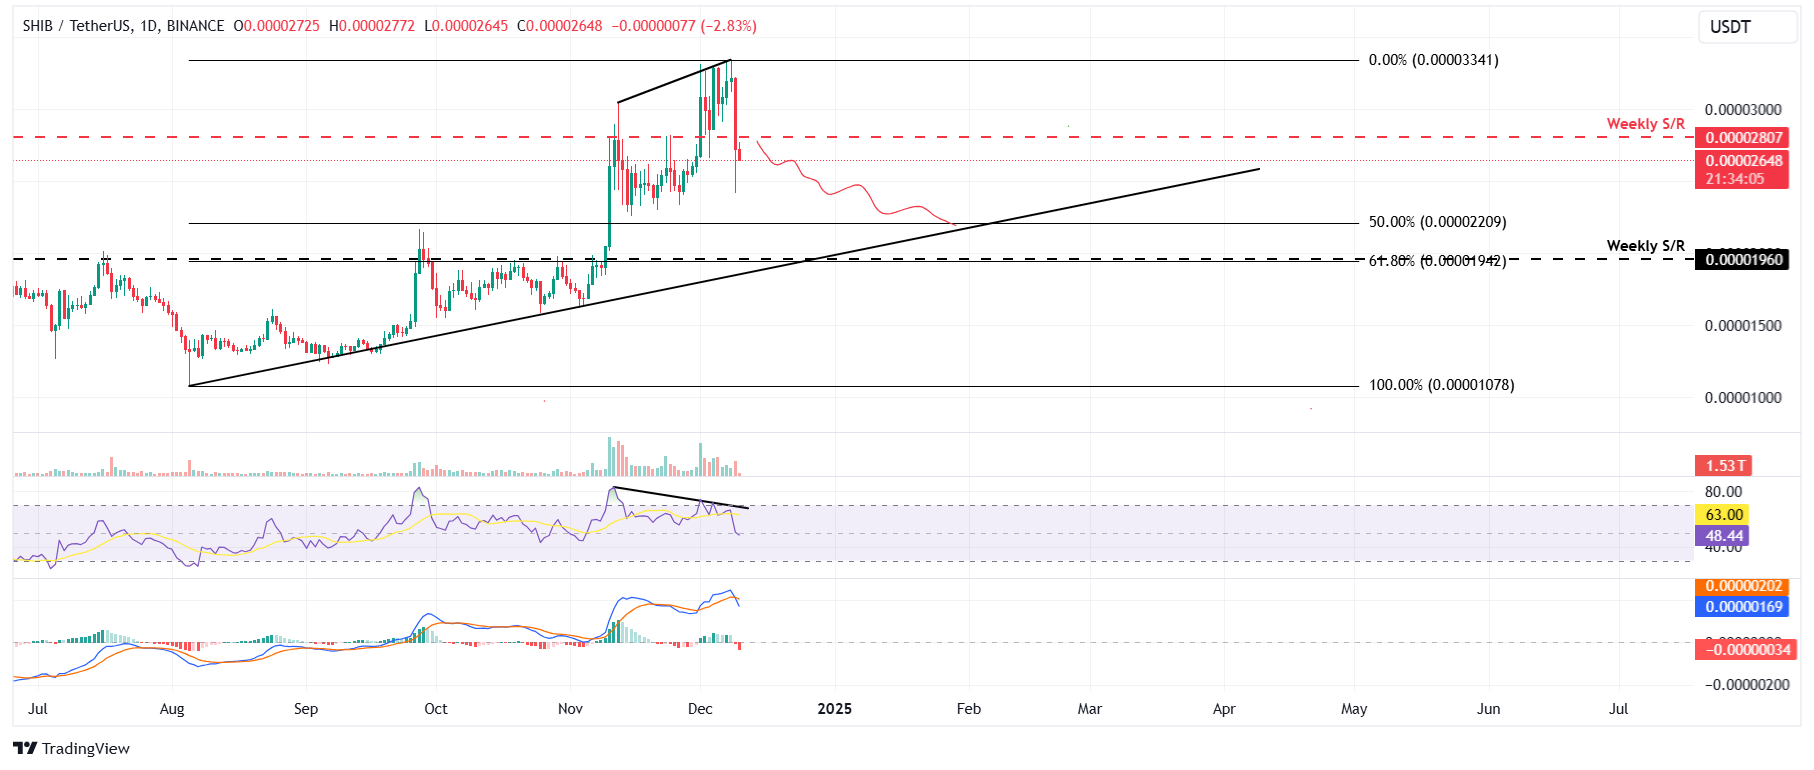
SHIB/USDT daily chart