- Dogecoin and Shiba Inu prices broke below their key support levels on Wednesday amid 9% declines the previous day.
- Santiment’s NPL metrics of these dog-themed memecoin show massive spikes, indicating traders realize profits.
- The technical outlook suggests a continuation of the downturn, as both memecoins’ RSI back bearish trends.
Dogecoin (DOGE) and Shiba Inu (SHIB) prices broke below their key support levels on Wednesday after declining more than 9% the previous day. On-chain data provider Santiments Network Realized Profit/Loss (NPL) indicator shows massive spikes in these dog-theme memecoins, indicating traders realize profits.
The technical outlook suggests the continuation of the downturn, as both memecoins Relative Strength Index (RSI) indicators show a bearish trend.
Dog-themed memecoins traders book profits and increase the selling pressure
On-chain data provider Santiments’ Network Realized Profit/Loss (NPL) shows massive spikes in these dog-theme memecoin.
This metric computes a daily network-level Return On Investment (ROI) based on the coin’s on-chain transaction volume. Simply put, it is used to measure market pain. Strong spikes in a coin’s NPL indicate that its holders are, on average, selling their bags at a significant profit. On the other hand, strong dips imply that the coin’s holders are, on average, realizing losses, suggesting panic sell-offs and investor capitulation.
In Dogecoin’s case, the metric rose from 36.01 million on Monday to 133.68 million on Tuesday. A similar spike was seen in SHIB during the same period, which rose from 1.18 million to 426.17 million. These spikes indicate that holders are, on average, selling their bags at a significant profit and increasing the selling pressure.
%20%5B09.24.36,%2008%20Jan,%202025%5D-638719106860454843.png)
DOGE Network Realized Profit/Loss chart. Source: Santiment
%20%5B09.26.21,%2008%20Jan,%202025%5D-638719107163704969.png)
SHIB Network Realized Profit/Loss chart. Source: Santiment
Dogecoin Price Forecast: DOGE shows signs of weakness
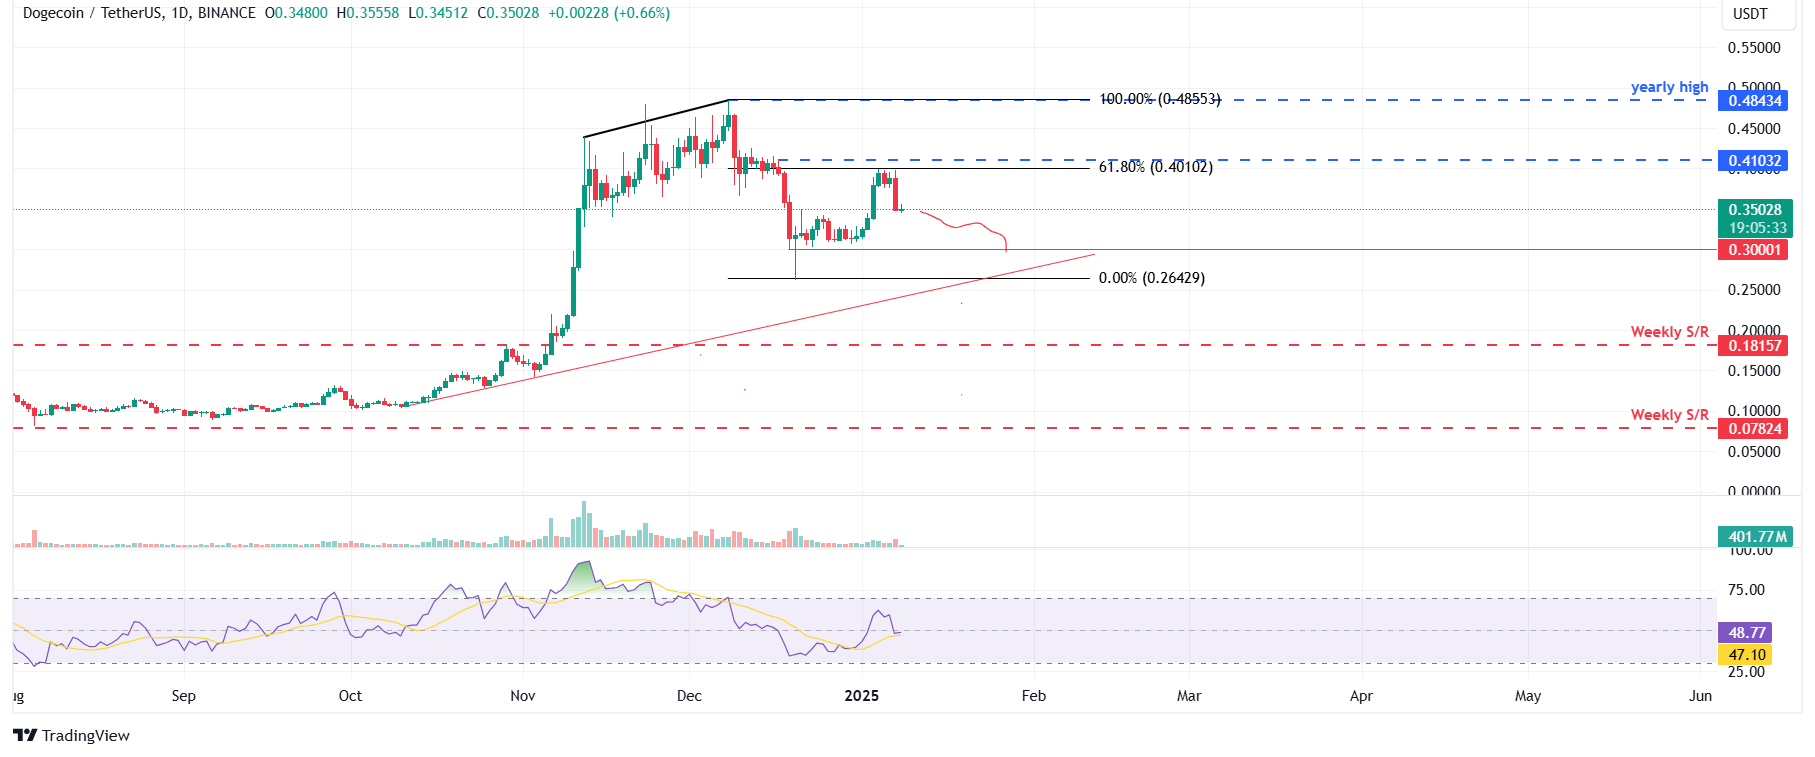
Dogecoin price faced rejection from its 61.8% Fibonacci retracement level drawn from the December 8 high of $0.48 to the December 20 low of $0.26 at $0.40, which declined 10.27% on Tuesday. At the time of writing on Wednesday, it hovers around $0.35.
If DOGE continues its rejection, it could extend its decline by 13% to retest its next daily support at $0.30.
The Relative Strength Index (RSI) indicator on the daily chart reads 48, below its neutral level of 50 and pointing downwards, indicating bearish momentum.

DOGE/USDT daily chart
Shiba Inu Price Forecast: Poised for a double-digit crash
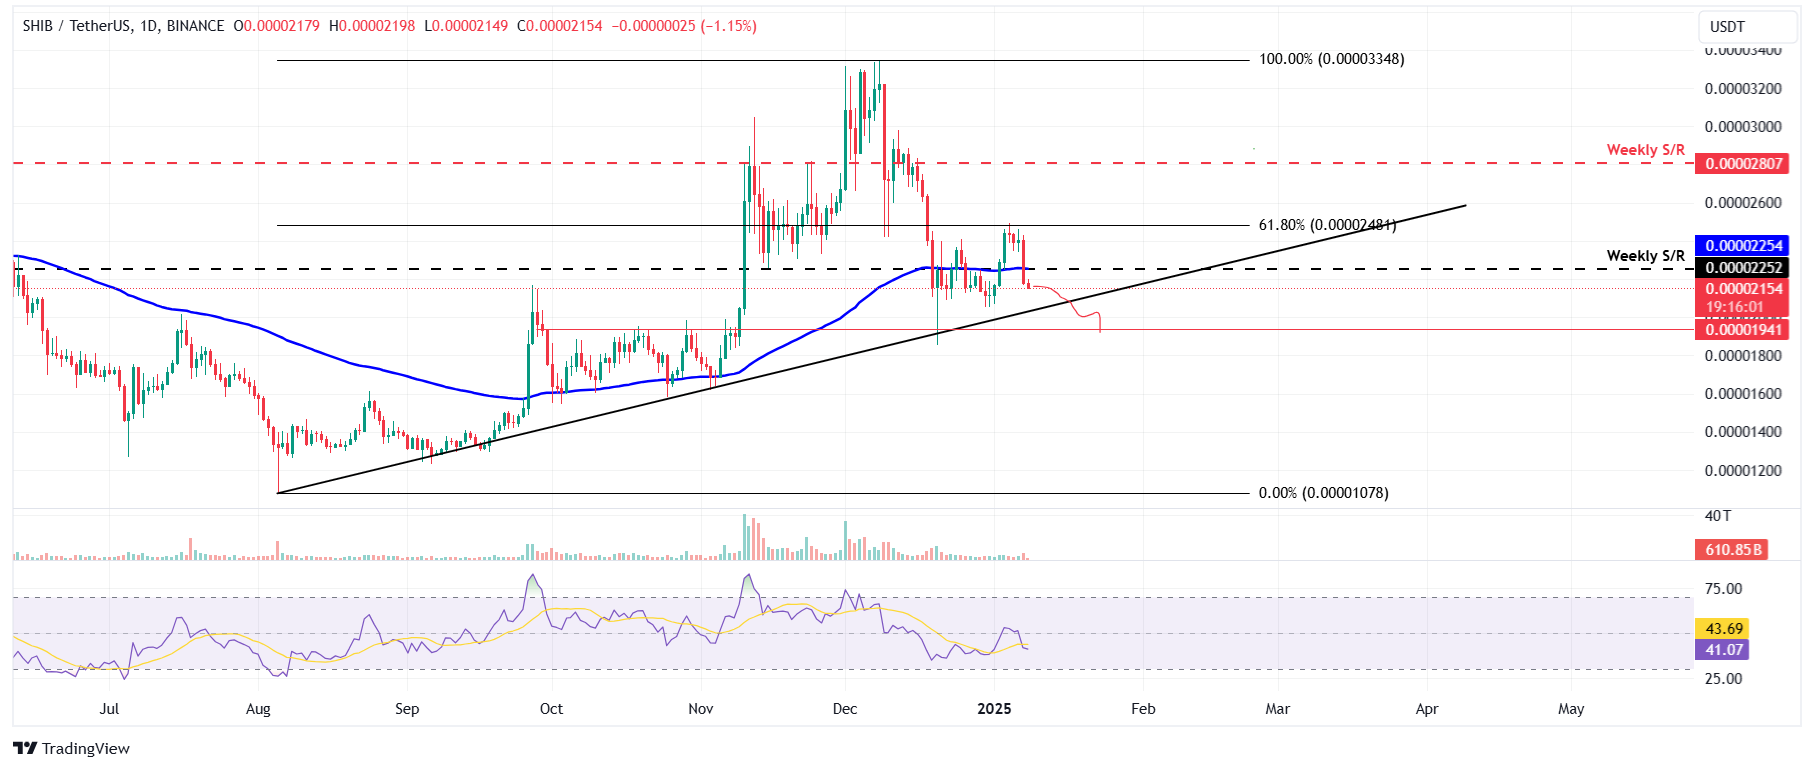
Shiba Inu price faced rejection from its 61.8% Fibonacci retracement level drawn from the August 5 low of $0.000010 to the December 8 high of $0.000033, at $0.000024 on Saturday, and declined 10.73% until Tuesday. At the time of writing on Wednesday, it continues to edge down around $0.000021.
If SHIB continues its correction, it could extend its decline by 11% to retest its next daily support at $0.000019.
The RSI indicator on the daily chart reads 41, below its neutral level of 50 and pointing downwards, indicating strong bearish momentum.

SHIB/USDT daily chart


