
- Bitcoin price has traded differently during US stock market open hours, ascribed to ETFs and institutions.
- Social metrics continue to dwindle as traders show weak ‘buy-the-dip’ interest, which explains multiple retests of $60,600.
- Crowd’s lack of faith could signify that prices are close to bottoming out.
Bitcoin (BTC) price efforts of a recovery this week have been countered by selling pressure during the onset of the American session. However, the downside potential appears to have been capped. Markets have noted significant trading differences between sessions, and while the Asian market showed strength, whatever ground they were able to cover was oftentimes wiped out by traders in the US.
Also Read: Bitcoin looks set to close week in red as price correction fumbles in US session
Bitcoin trades differently during US stock market open hours
Bitcoin price has frowned faces during US stock market open hours despite notable efforts by Asian traders. While regions such as Hong Kong are still ecstatic about the recent launch of BTC and ETH exchange-traded funds (ETFs), BTC in Wall Street delivered by US spot ETFs showed the opposite.
Amid increasing outflows and subsiding institutional buying, demand for BTC has quelled. For instance, markets reported $11.3 million in outflows from ETFs in the US on Thursday.
- Grayscale was the only ETF provider to experience negative flows yesterday, with outflows reaching $43.4 million.
- After two days of zero flows, BlackRock reported positive ETF flows yesterday, totaling $14.2 million.
- Among other ETF providers, Fidelity had positive flows of $2.7 million, Bitwise saw $6.8 million, ARK had $4.4 million, Invesco recorded $2.2 million, and Franklin saw $1.8 million. The other providers reported zero flows.
While net flows were negative, it was encouraging that Thursday marked the sixth day where every ETF provider, except Grayscale, had either positive or no flows. It points to a budding trend with Grayscale, showing that their negative flows have significantly decreased. Volume has remained mute however.
When the Bitcoin ETFs launched four months ago there were no sellers, only buyers. Now that so many investors own the ETFs, the supply of potential sellers is large. However, with waning demand from new buyers, ETF outflows will continue to put significant downward pressure on BTC prices.
Why the bottom is near
Santiment data shows that social dominance and social volume metrics have reduced this week by 3.05% and $34.19%, respectively. Since peaking on April 21, the metrics have dropped by 9.54% and 50.28%, respectively.
Social volume points to the amount of mentions of the coin on over 1000 crypto-related social media channels. Social dominance on the other hand indicates the percentage of the coins mentioned on crypto related social media relative to a pool of over 50 of the most talked about projects.
%20%5B21.16.53,%2010%20May,%202024%5D-638509666777022666.png)
BTC price, social dominance, social dominance
The dwindling social metrics shows the mainstream crowd is discussing them at lower rates, meaning there is no FOMO (fear of missing out). This often translates to low volatility for the concerned asset.
- As buy calls across social media are low and sell calls are peeking in at an increased rate (particularly in the US), market recovery probabilities increase.
- Mentions of BTC and ‘buy the dip’ calls are increasing, pointing to polarization between traders.
- An appealing level of worrying among traders is noticeable in the market, suggesting a relief rally is around the corner.
The crowd is leaning bullish based on history’s price performance after the halving and the ETF euphoria. However, the ability for Bitcoin price to climb to $80,000 and beyond largely hinges on whale and shark behavior.
It also depends on how much dormant BTC addresses will continue pouring back into mainstream circulation and the network’s realized profits versus losses, among other factors.
Bitcoin price outlook
Bitcoin price continues to consolidate within a falling wedge pattern on the one-day time frame, formed when the price consolidates between two converging trendlines that slope downward. As the price continues to move within this pattern, it usually indicates a temporary pause or retracement in a downtrend.
When the price breaks out above the upper trendline of the falling wedge pattern, it is often seen as a bullish signal. This breakout suggests that buying pressure is building up and that a potential trend reversal or uptrend could follow. Traders may interpret this breakout as a signal to go long or enter a buy position.
As explained in a previous FXStreet publication, the profit target for the falling wedge pattern is a 20% move above the breakout point to the area near $71,116. In a highly bullish case, Bitcoin price could extend to take back the $73,777 peak.
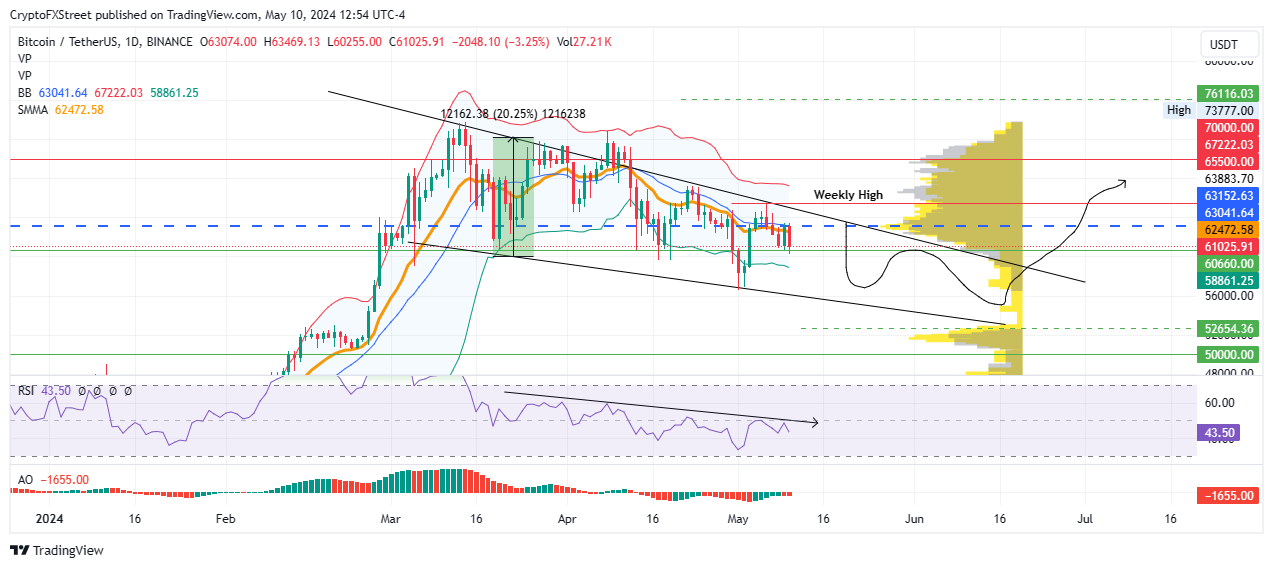
BTC/USDT 1-day chart
On the one-week time frame, the $60,660 threshold continues to hold as support, with the Relative Strength Index (RSI) recording higher highs. Until such a time when this momentum indicator confirms a lower high, the prevailing directional bias remains an uptrend.
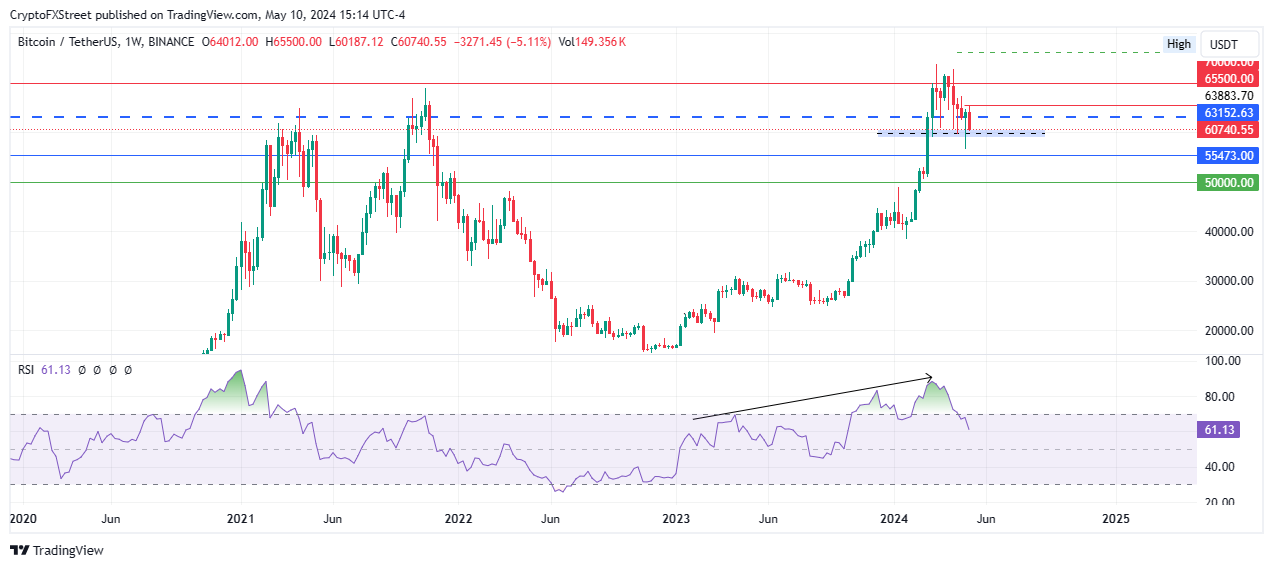
BTC/USDT 1-week chart
If the bears are able to flip the $55,473 support into resistance on the weekly time frame, or record a candlestick close below $56,000 on the one-day time frame, it would invalidate the bullish thesis.
Bitcoin, altcoins, stablecoins FAQs
Bitcoin is the largest cryptocurrency by market capitalization, a virtual currency designed to serve as money. This form of payment cannot be controlled by any one person, group, or entity, which eliminates the need for third-party participation during financial transactions.
Altcoins are any cryptocurrency apart from Bitcoin, but some also regard Ethereum as a non-altcoin because it is from these two cryptocurrencies that forking happens. If this is true, then Litecoin is the first altcoin, forked from the Bitcoin protocol and, therefore, an “improved” version of it.
Stablecoins are cryptocurrencies designed to have a stable price, with their value backed by a reserve of the asset it represents. To achieve this, the value of any one stablecoin is pegged to a commodity or financial instrument, such as the US Dollar (USD), with its supply regulated by an algorithm or demand. The main goal of stablecoins is to provide an on/off-ramp for investors willing to trade and invest in cryptocurrencies. Stablecoins also allow investors to store value since cryptocurrencies, in general, are subject to volatility.
Bitcoin dominance is the ratio of Bitcoin’s market capitalization to the total market capitalization of all cryptocurrencies combined. It provides a clear picture of Bitcoin’s interest among investors. A high BTC dominance typically happens before and during a bull run, in which investors resort to investing in relatively stable and high market capitalization cryptocurrency like Bitcoin. A drop in BTC dominance usually means that investors are moving their capital and/or profits to altcoins in a quest for higher returns, which usually triggers an explosion of altcoin rallies.