- Aave price finds support around $96.13 at its 200-day EMA level, with an impending rally eyed ahead.
- On-chain data shows that AAVE’s open interest, daily active addresses and development are rising, signaling a bullish move in price.
- Artemis Analytics data shows that AAVE has generated daily revenue of $1.2 million, the highest since February.
- A daily candlestick close below $90.19 would invalidate the bullish thesis.
Aave (AAVE) price trades slightly higher during the Asian trading session on Thursday after surging on Wednesday. On-chain data shows that open interest, daily active addresses and development activity are rising, signaling a bullish trend. Additionally, Artemis Analytics shows that the DeFi platform’s revenue has reaches the highest level since February end, in another encouraging sign for the token’s outlook.
AAVE price shows potential for a rally
Aave price retested and bounced off the support area, extending between $76.83 and $72.55, on August 5. It found support on the 200-day Exponential Moving Average (EMA), which hovers around $96.13. At the time of writing, it trades slightly higher, 0.27%, at $106.39 on Thursday after increasing by a sharp 8.4% on Wednesday
If the 200-day EMA holds as support, Aave price could rally 10% to retest its daily resistance level at $116.02.
The Relative Strength Index (RSI) on the daily chart trades above the neutral level of 50, and the Awesome Oscillator (AO) trades slightly below its neutral level of zero. For bullish bias to sustain both, the momentum indicators should be above their neutral levels, which could add a tailwind to the ongoing rally.
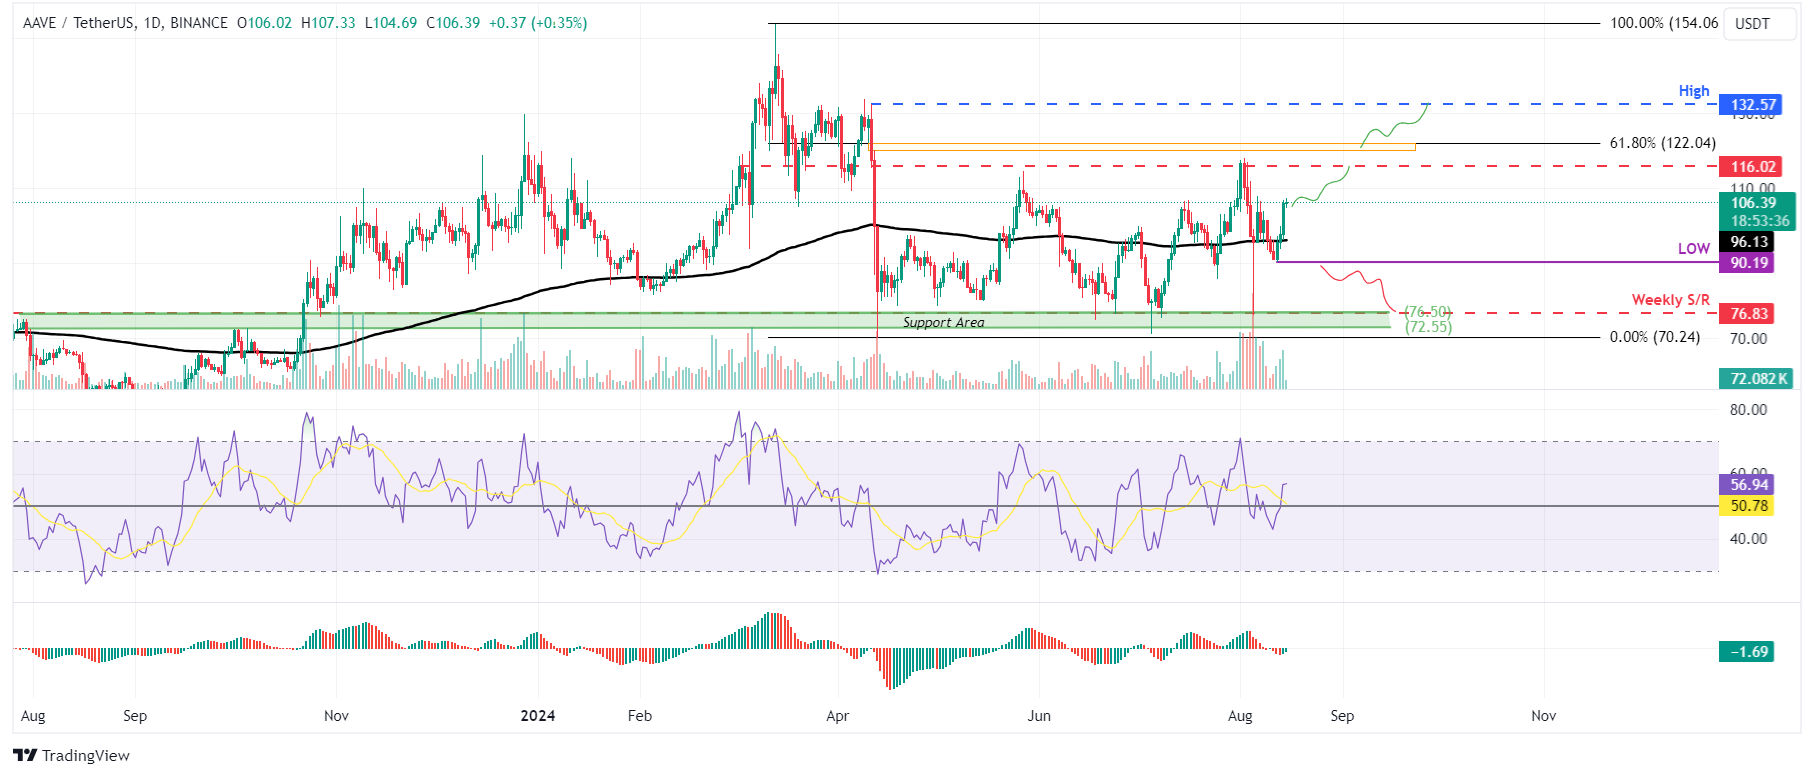
AAVE/USDT daily chart
AAVE on-chain metrics improve
Santiment’s Development Activity Index shows project development activity over time based on several pure development-related events in the project’s public GitHub repository.
In AAVE’s case, the index has been rising since July 24, which implies that the AAVE developing activity is increasing, adding further credence to the bullish outlook.
%20%5B10.51.13,%2015%20Aug,%202024%5D-638593019191097070.png)
AAVE Development Activity Index chart
Data from CoinGlass shows that the futures’ Open Interest (OI) in Aave at exchanges is also increasing. The OI indicates the total number of outstanding derivative contracts that have not been settled (offset by delivery) and whether money flows into the contract are increasing or decreasing.
Increasing OI represents new or additional money entering the market and new buying, which suggests a bullish trend. When OI decreases, it is usually a sign that the market is liquidating, more investors are leaving, and the current price trend is ending.
The graph below shows that AAVE’s OI increased from $60.20 million on Monday to $90.30 million on Wednesday, indicating that new or additional money is entering the market and new buying is occurring.
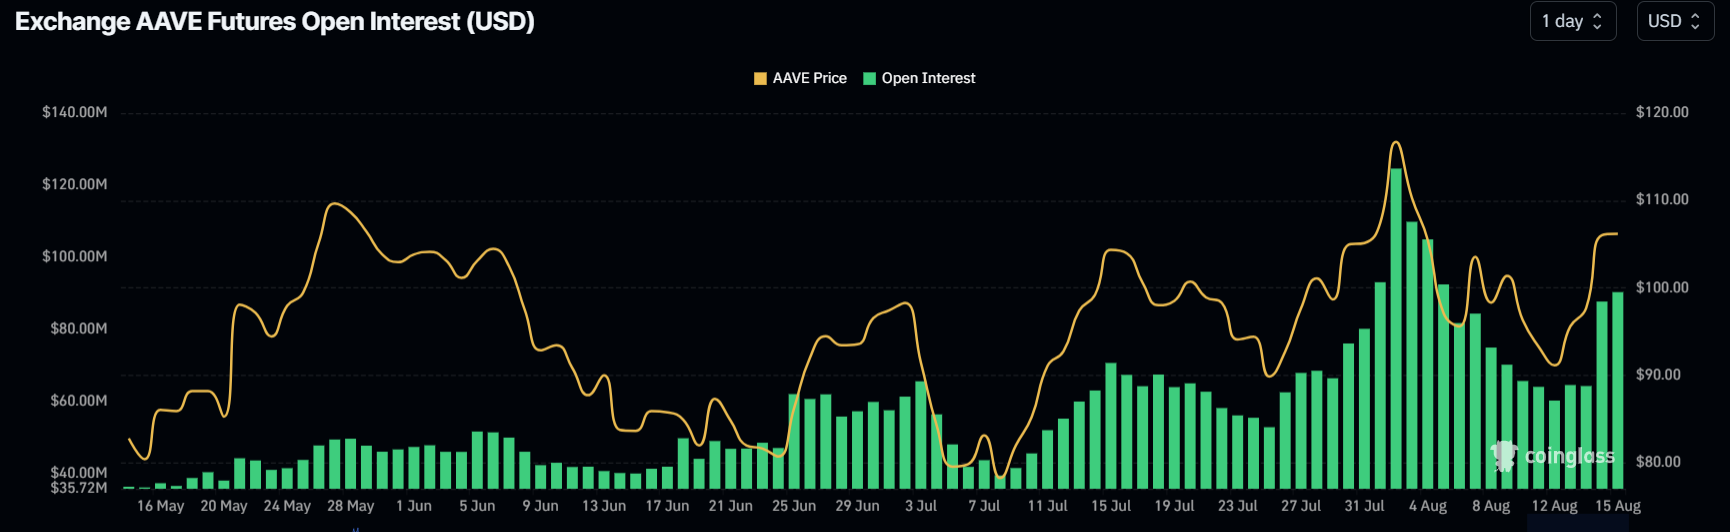
AAVE Open Interest chart
Santiment’s Daily Active Addresses index, which helps track network activity over time, aligns with the bullish outlook noted from a technical perspective. A rise in the metric signals greater blockchain usage, while declining addresses point to lower demand for the network.
In AAVE’s case, Daily Active Addresses rose by 90% in one day and have been rising constantly this week, indicating that demand for AAVE’s blockchain usage is increasing.
%20%5B10.12.17,%2015%20Aug,%202024%5D-638593019943299717.png)
AAVE Daily Addresses chart
Additionally, data from Artemis Analytics shows that AAVE generated $1.2 million in revenue on Monday, the highest daily revenue since February end, further adding credentials to the bullish outlook.
-638593020255623460.jpg)
Aave Revenue chart
Despite the bullish outlook suggested by technical analysis and on-chain data, if the AAVE daily candlestick closes below the $90.19 daily low of August 12, the outlook will shift to bearish. This scenario could lead to a 15% crash to retest its weekly support at $76.83.