- Cardano’s price hovers around $0.74 on Thursday after a recovery of over 4% so far this week.
- On-chain data hints at a bullish picture as ADA’s stablecoin market cap rises while its bullish bets increase among traders.
- However, Cardano’s dormant wallets’ activity could limit gains.
Cardano (ADA) price hovers around $0.74 at the time of writing on Thursday after a recovery of over 4% so far this week. On-chain data hints at a bullish picture as ADA’s stablecoin market cap rises while its bullish bets increase among traders.
Cardano bullish bets reach a monthly high
Coinglass’s long-to-short ratio data for Cardano reads 1.15, the highest level over a month. This ratio above one reflects bullish sentiment in the markets as more traders are betting for the asset price to rise.
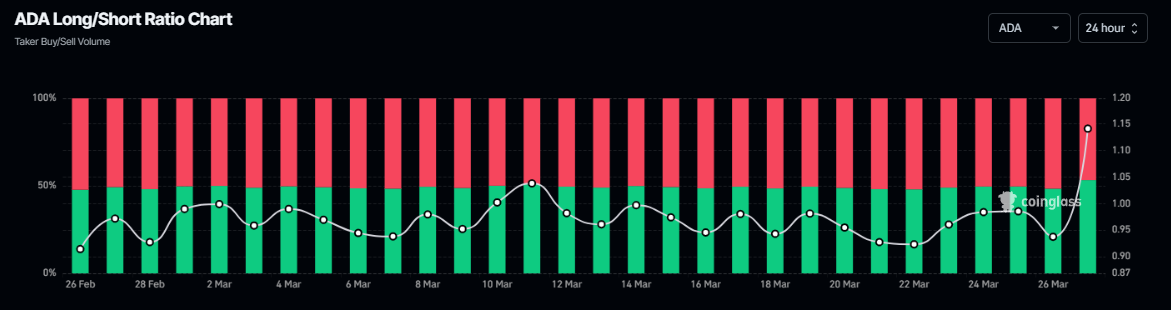
ADA long-to-short ratio chart. Source: Coinglass
Another bullish sign is ADA’s rising stablecoin market capitalization reached a new all-time high of $30.77 million on Monday, according to DefiLlama data. This increase indicates growing utility and adoption of Decentralized Finance (DeFi) on Cardano, boosting stablecoin usage.
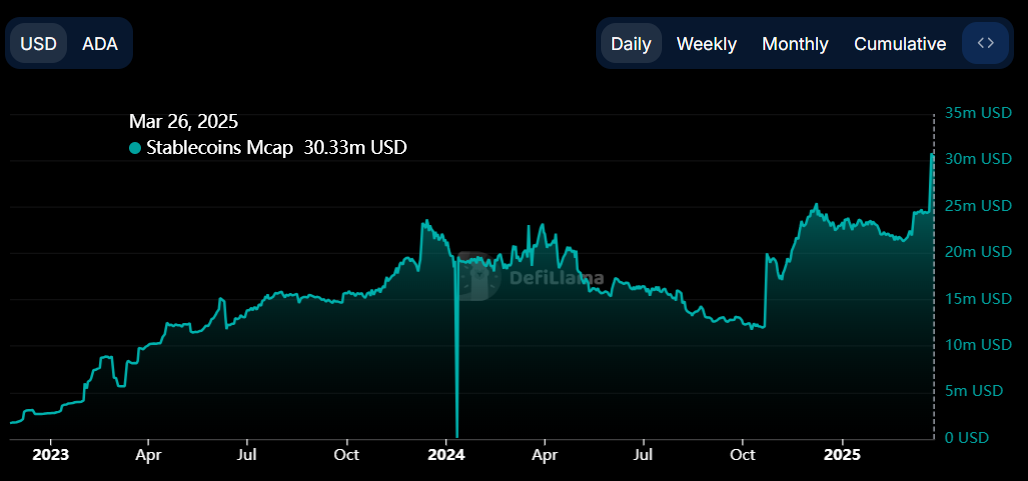
ADA’s stablecoin market capitalization chart. Source: DefiLlama
Cardano’s technical outlook projects double-digit gains
Cardano’s price faced rejection around its 50-day Exponential Moving Average of around $0.77 on Wednesday and declined 2.16%. This level roughly coincided with the weekly resistance level at $0.74, making it a key resistance zone. At the time of writing on Thursday, it trades slightly above $0.74.
If ADA breaks above its weekly resistance and closes above $0.77, its 50-day EMA, it could extend the rally by 13% from its current level to retest its next resistance at $0.83.
The Relative Strength Index (RSI) on the daily chart reads 49 and points upward toward its neutral level of 50, indicating fading bearish momentum. However, the RSI must move above its neutral level of 50 for the bullish momentum to be sustained. The Moving Average Convergence Divergence (MACD) indicator on the daily chart also showed a bullish crossover on Tuesday, indicating a buy signal and an upward trend.
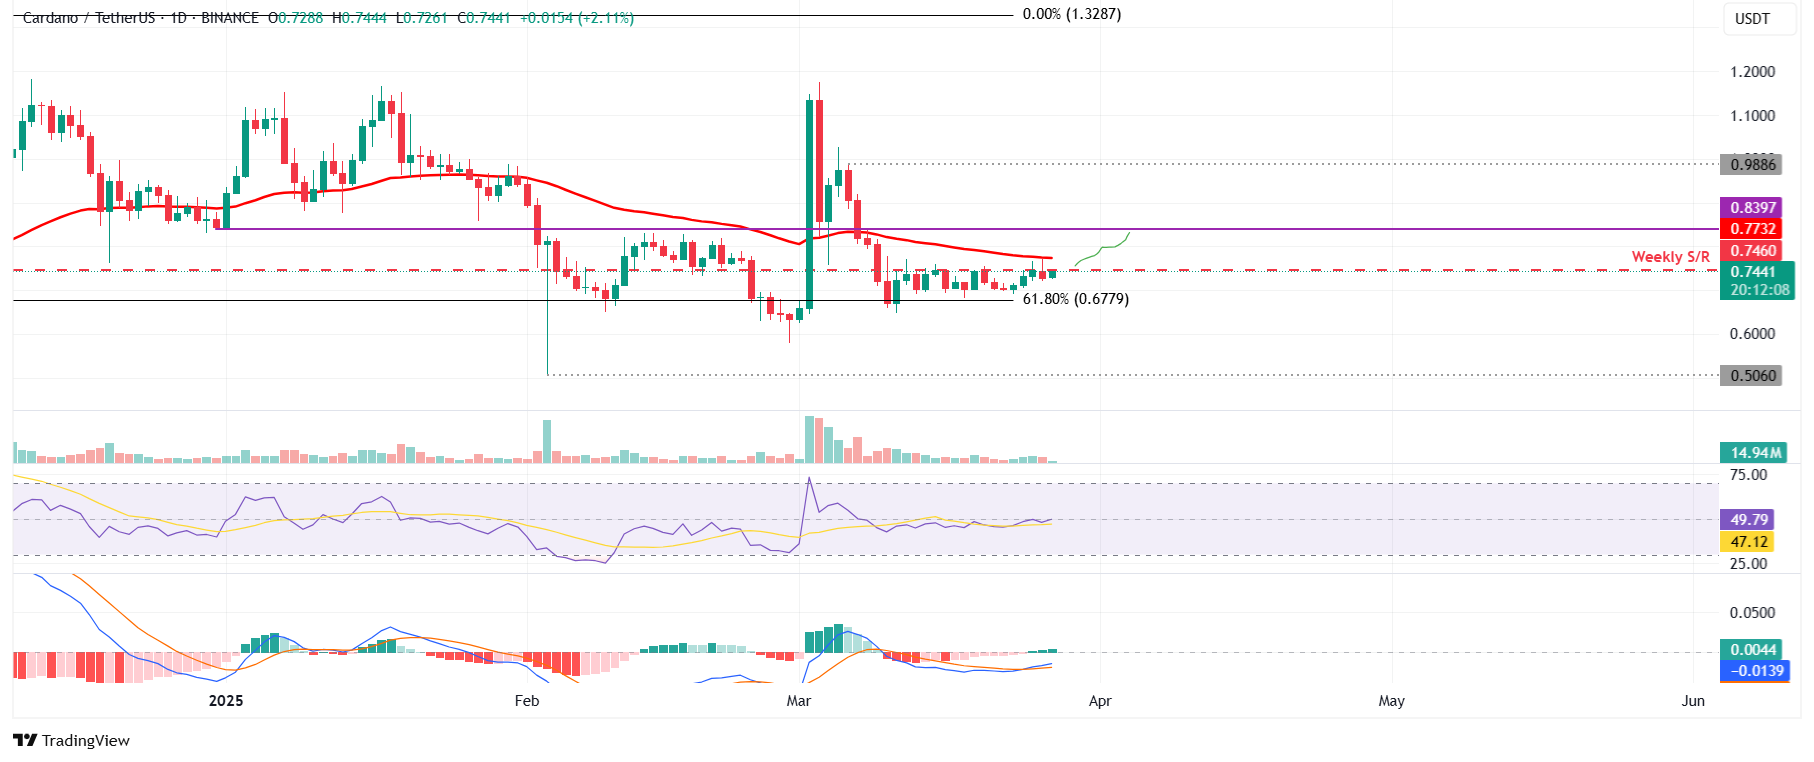
ADA/USDT daily chart
Despite the bullish outlook suggested by Cardano’s on-chain metrics and technical analysis, traders should be cautious as the Santiment Age Consumed metric shows a spike, indicating that ADA’s dormant wallets are moving and could raise the selling pressure, bringing Cardano’s price down.
%20%5B08.23.24,%2027%20Mar,%202025%5D-638786463281939757.png)
ADA’s Age Consumed chart. Source: Santiment