- Avalanche price retests its trendline support area at $26.34, with potential recovery on the cards.
- On-chain data shows AVAX’s development activity is growing, suggesting a bullish move ahead.
- A daily candlestick close below $21.99 would invalidate the bullish move.
Avalanche (AVAX) price bounced off the $26.34 support level to trade at $27.95 as of Friday. Growing on-chain development activity indicates a potential bullish move in the coming days.
Avalanche looks promising for a rally ahead
Avalanche price faced rejection by the daily resistance at $32.66 earlier this week, extended the correction move for the fourth day in a row and retested the trendline support at $26.34.At the time of writing, AVAX bounced off the trendline support and trades higher by 2%, around $27.95, on Friday.
If the $26.34 level holds, AVAX could rally 24% to retest its daily resistance at $32.66.
The Relative Strength Index (RSI) on the daily chart has briefly slipped below the 50 mid-line, while the Awesome Oscillator (AO) is on its way to doing the same. If bulls are indeed making a comeback, then both momentum indicators must maintain their positions above their respective mean levels. Such a development would add a tailwind to the recovery rally.
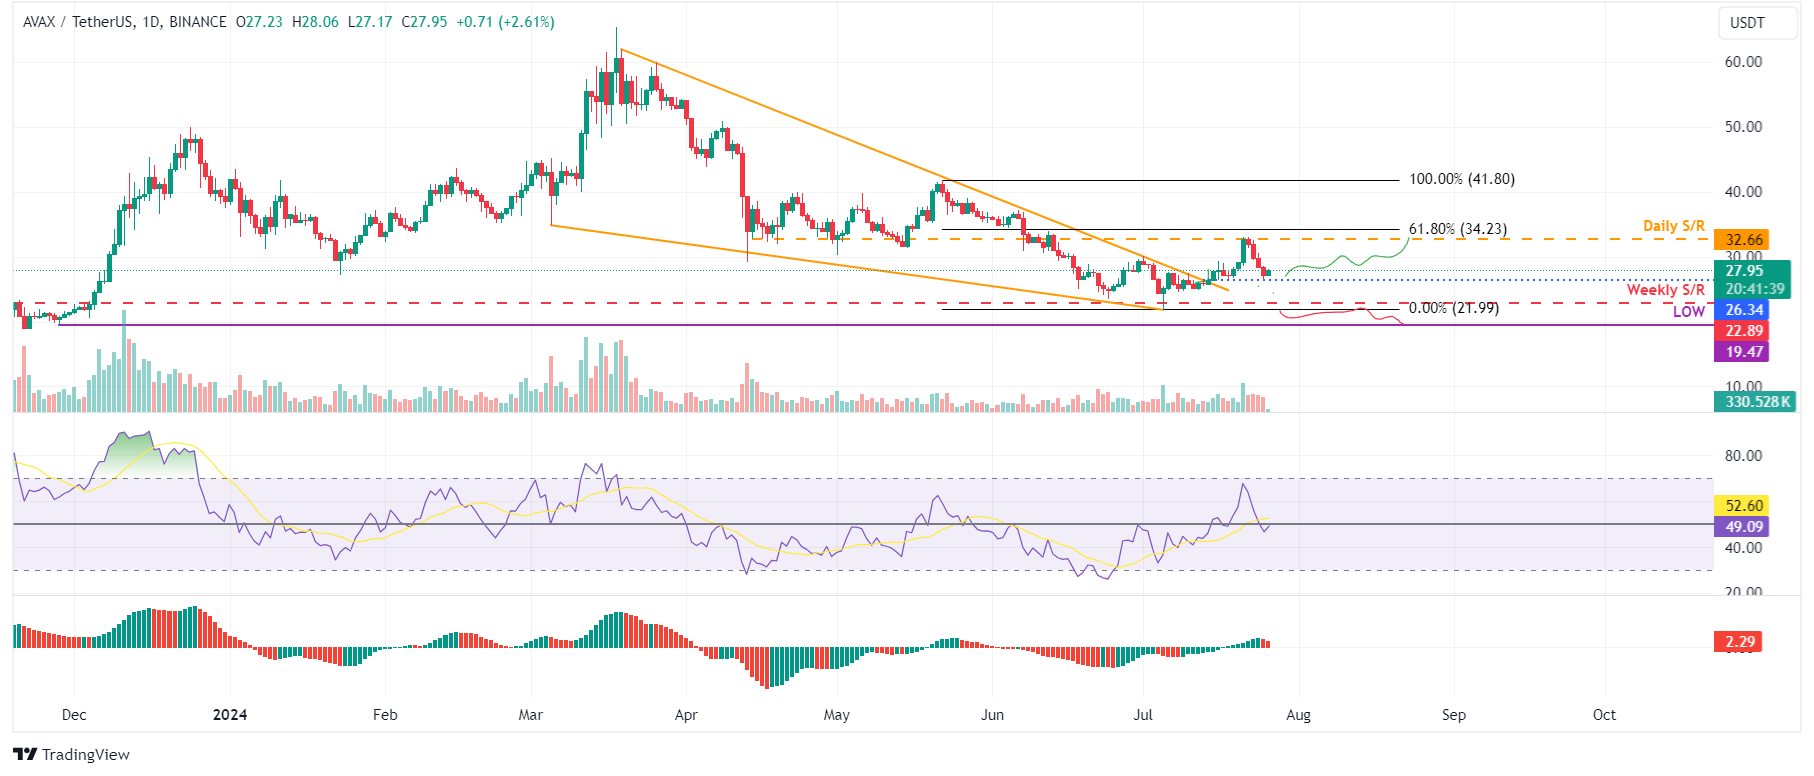
AVAX/USDT daily chart
Based on IntoTheBlock’s In/Out of the Money Around Price (IOMAP), nearly 147,960 addresses accumulated 1.24 million AVAX tokens at an average price of $27.43. These addresses bought Avalanche tokens between $26.99 and $27.78, which makes it a key support zone.
Interestingly, the $26.99 to $27.78 zone mentioned from a technical analysis perspective coincides with the IOMAP findings, making this zone a key reversal area to watch.
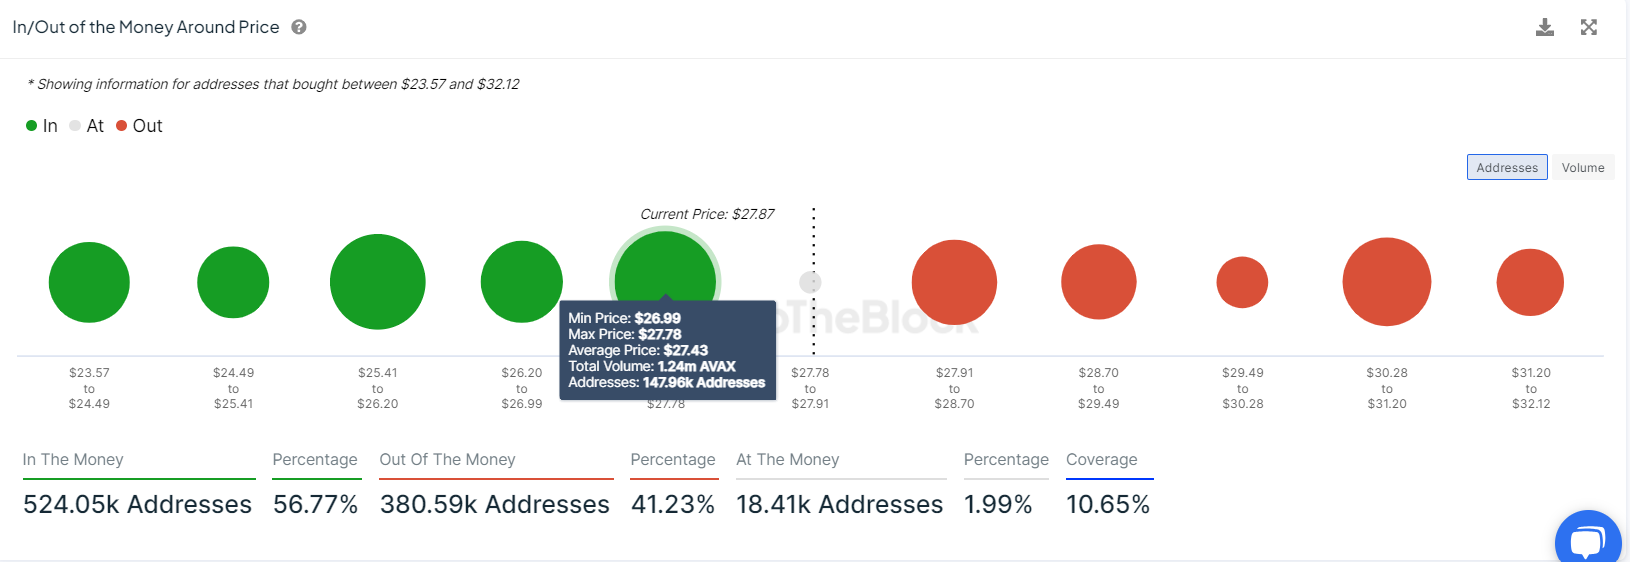
AVAX IOMAP chart
Santiment’s Development Activity index shows project development activity over time based on several pure development-related events in the project’s public GitHub repository.
In AVAX’s case, the index sharply rose from 179 on July 22 to 188 on July 25. This trend has been rising since July 16 and implies that the Avalanche price-developing activity is high, which adds further credence to the bullish outlook.
%20%5B08.50.14,%2026%20Jul,%202024%5D-638575655292189690.png)
AVAX Development Activity chart
Even though on-chain metrics and technical analysis point to a bullish outlook, if AVAX’s price makes a daily candlestick close below $21.99, the bullish thesis would be invalidated by creating a lower low on the daily chart. This development could see Avalanche’s price decline by 11% to retest its daily low of $19.47 from November 28, 2023.