


- Dusk price retests and finds support around the 50% price retracement level at $0.195, eyeing a rally ahead.
- On-chain data paints a bullish picture as DUSK’s Exchange Flow Balance and Supply on Exchanges decrease.
- A daily candlestick close below $0.190 would invalidate the bullish thesis.
Dusk (DUSK), a Layer 1 blockchain protocol that brings classic finance and real-world assets (RWA) on-chain, recovers initial weekly losses and recaptures the $0.210 level, up 5% in the day on Wednesday. DUSK could extend gains by 17% after the coin’s price recently retested and found support around a key level. Additionally, on-chain data such as Exchange Flow Balance and Supply on Exchanges hints at an upcoming rally.
Dusk price shows potential for a rally
Dusk price was under selling pressure at the beginning of the week, but was able to find support at around its 50% price retracement level (drawn from a low in early August to a high in early September ) at $0.195. This level roughly coincides with the daily support level of $0.190, making it an important support zone. At the time of writing on Wednesday, it is trading 5% higher in the day, just above $0.212.
If the $0.190 level continues to hold as support, DUSK could rally 17% from its current trading level to retest its daily resistance level at $0.248.
The Relative Strength Index (RSI) on the daily chart trades around its neutral level of 50, and the Awesome Oscillator (AO) also hovers around the neutral level of zero. These indicators indicate neither bulls nor bears are in control of the momentum. For the bullish momentum to persist, both indicators must maintain and trade above their neutral levels, suggesting a recovery rally ahead.
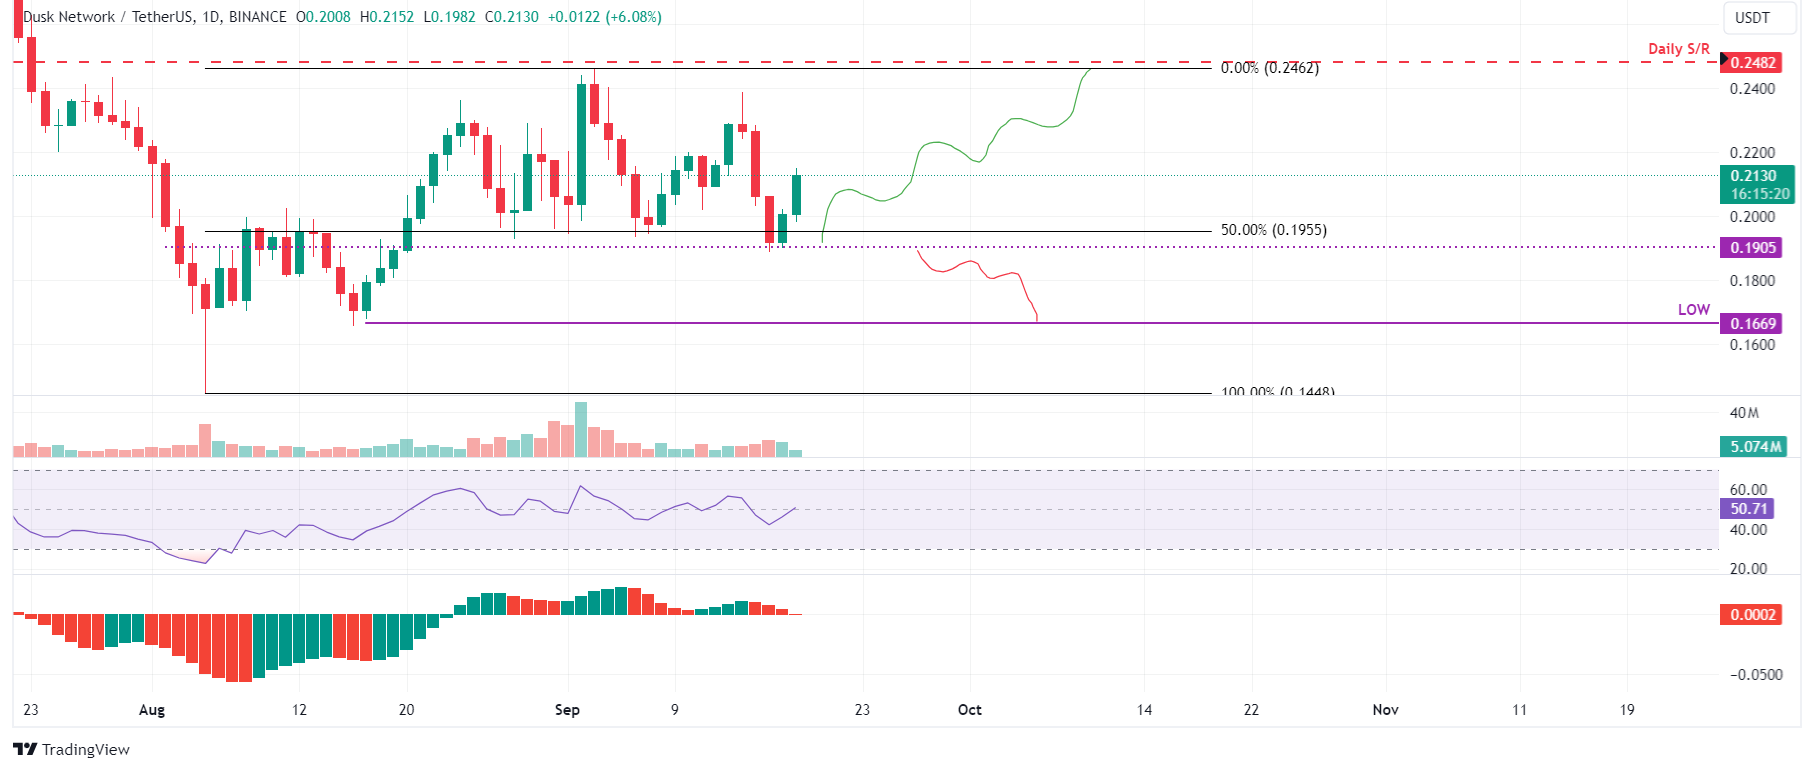
DUSK/USDT daily chart
Looking into on-chain data suggests a bullish outlook for Dusk’s price. According to IntoTheBlock’s In/Out of the Money Map (IOMAP) data, about 74 addresses purchased 53.23 million DUSK tokens at an average price of $0.190. These addresses bought the Layer 1 blockchain-based tokens between $0.188 and $0.194, suggesting a critical support zone.
The $0.190 support level from the technical analysis perspective aligns with the IOMAP findings, marking this zone as a crucial reversal point to watch.
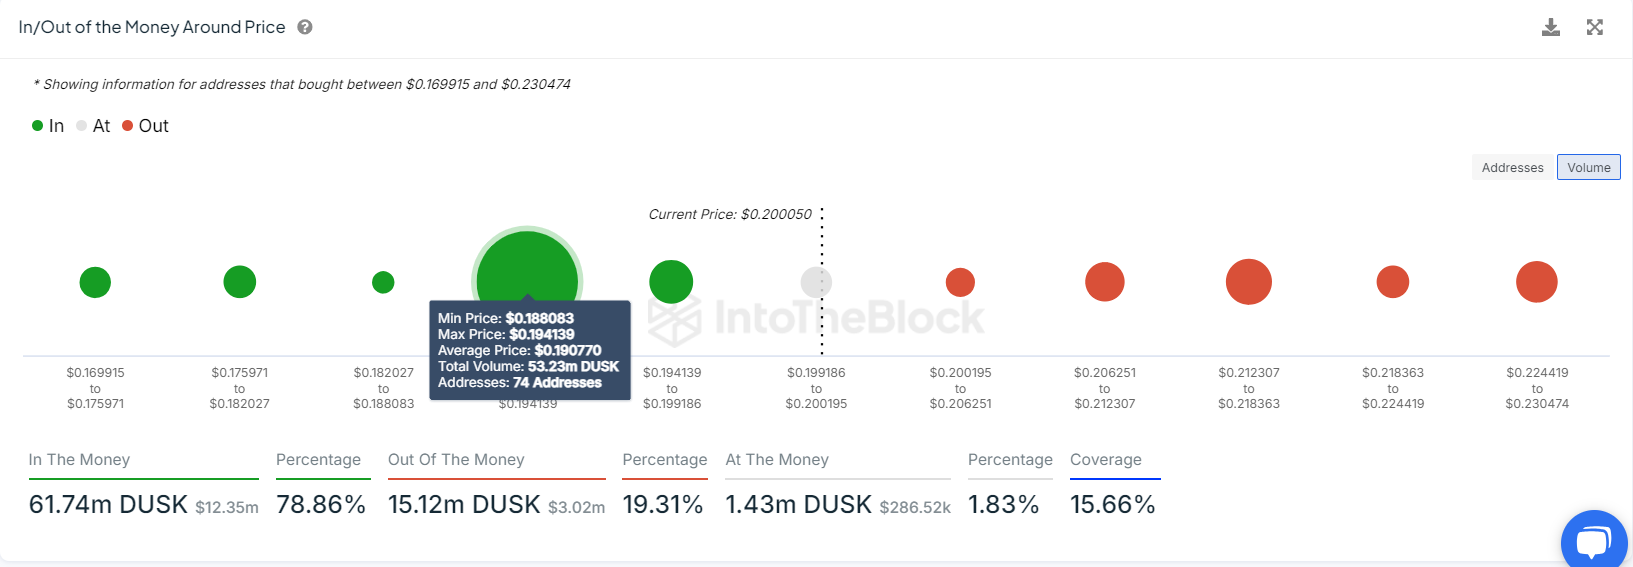
DUSK IOMAP chart
Santiments’ Exchange Flow Balance metric also aligns with Dusk’s bullish technical perspective. This metric shows the net transfer of tokens into and out of the exchange. A positive spike suggests that more tokens have entered than exited, indicating investors’ pressure to sell. A negative spike, on the other hand, suggests that more tokens left the market than arrived, implying that investors are less likely to sell.
For Dusk’s case, the Exchange Flow Balance metric slumped from 41,231 on Monday to -455,170 on Tuesday. This negative dip suggests investors are taking out more tokens from exchanges and are less likely to sell them. Leading to a decrease in the Supply on Exchanges by 1%, which suggests investor confidence in the Dusk network.
%20%5B10.42.46,%2018%20Sep,%202024%5D-638622424094163537.png)
DUSK Exchange Flow Balance and Supply on Exchange Chart
Despite the optimistic view given by technical analysis and on-chain metrics, if Dusk’s daily candlestick closes below $0.190, the bullish thesis will be invalidated by the formation of a lower low on the daily timeframe. This outcome would result in a 12% drop in Dusk’s price, retesting its August 16 low of $0.166.