
- Solana price has failed to overcome the 200-day EMA around $140.23, increasing the chances of a price decline ahead.
- On-chain data paints a bearish picture as SOL’s long-to-short ratio is below one, while a large investor is selling its holdings.
- A daily candlestick above $140.23 would invalidate the bearish thesis.
Solana (SOL) seems set to unwind most of its recent gains if it fails to surpass the 200-day Exponential Moving Average (EMA) around $140.23, a key level that acted as a resistance on Tuesday. This bearish thesis is also supported by on-chain metrics that show investors are anticipating price declines, with one large wallet offloading its SOL holdings.
Solana price at risk as it approaches key resistance
Solana price broke below the ascending trendline (drawn by connecting multiple low levels from the end of January) on Saturday and declined 6% over the next three days. On Tuesday, SOL price got close to the key 200-day EMA, but it wasn’t able to overcome it. The altcoin recovered 5% on Wednesday, but it is edging down again on Thursday.
This 200-day EMA at $140.23 roughly coincides with the broken ascending trendline that has previously acted as resistance and a 50% price retracement level at $136.77, making it a key resistance zone.
If the 200-day EMA holds as resistance once again, Solana price could decline 14% to its restest daily support level at $120.91.
The Relative Strength Index (RSI) and the Awesome Oscillator (AO) on the daily chart trade below their neutral levels of 50 and zero, but still above oversold territory. Both indicators signal a weak momentum and indicate the possibility that the bearish trend continues.
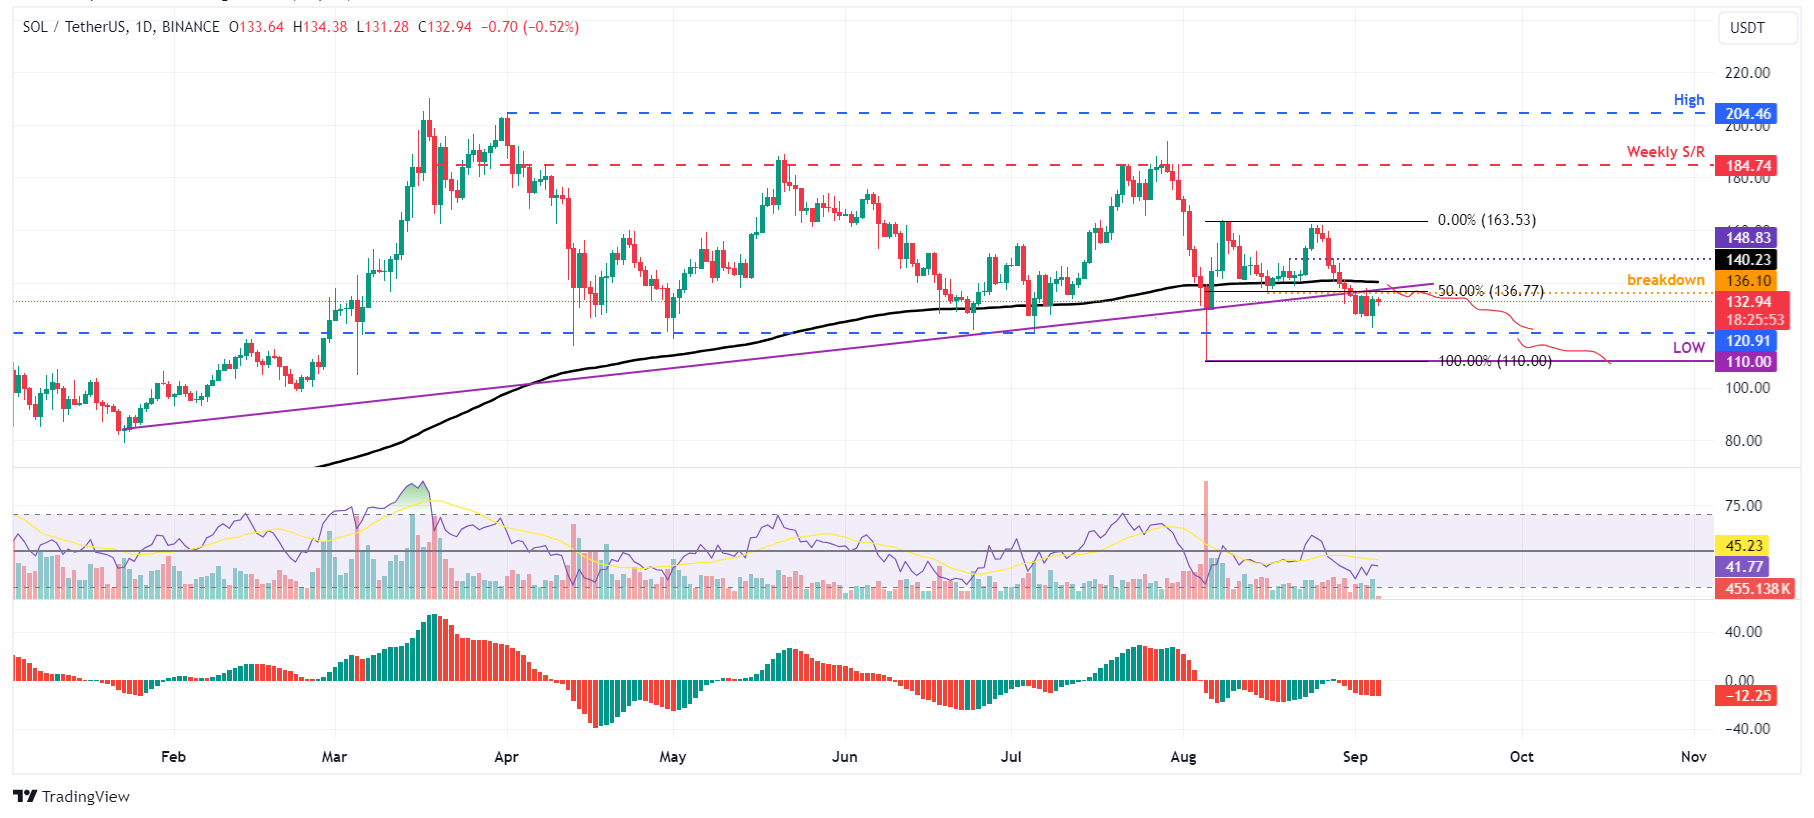
SOL/USDT daily chart
On-chain metrics also support a further downside. According to Coinglass, Solana’s long-to-short ratio also stands at 0.89, below one. It’s at the lowest level since August 11, meaning that more traders anticipate the asset’s price to fall.
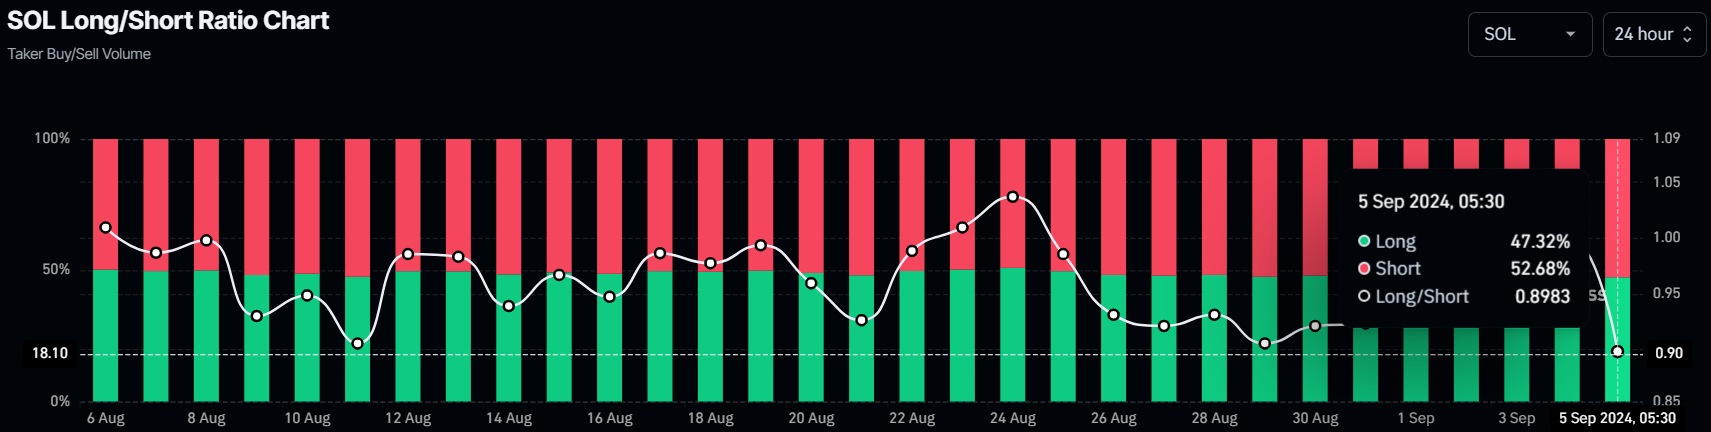
SOL long-to-short ratio chart
According to Lookonchain data, a whale or an institution has sold 695,000 SOL tokens worth $99.5 million this year. Since January 1, this wallet has sold an average of 19,306 SOL tokens worth $2.76 million weekly. If this trend continues, the SOL price could decline further as movements from large investors tend to influence market sentiment around the coin.
Despite the bearish thesis signaled by both on-chain data and technical analysis, the outlook will shift to bullish if SOL’s daily candlestick closes above $140.23, its 200-day EMA. This scenario could lead to a 6% rise to retest the August 28 high at $149.30.