- Avalanche price extends its gains on Monday after rallying nearly 9% in the previous week.
- On-chain metrics suggest a bullish picture as AVAX’s long-to-short ratio reached its highest in over a month.
- The technical outlook and funding rates data suggest a rally continuation, targeting an additional 20% gain.
Avalanche (AVAX) price extends its gains by 7%, trading above $21 on Monday after rallying almost 9% the previous week. On-chain metrics suggest a bullish outlook as AVAX’s long-to-short ratio reached its highest in over a month. The technical analysis and funding rates data suggest a rally continuation, targeting 20% additional gains.
Avalanche shows bullish bias as it closes above its descending trendline
Avalanche price broke and found support around its descending trendline (drawn by connecting multiple high levels from mid-December) last week and rallied nearly 7%. At the start of this week, on Monday, it is continuing to trade above $21.39, scoring 7% in gains.
If AVAX continues the upward trend and closes above its weekly resistance at $20.99, it could extend the rally by 17% to retest its next key level at $24.99. A successful close above this level would extend additional gains by 20% to retest its key psychological level of $30.
The Relative Strength Index (RSI) on the daily chart reads 53, pointing upward above its neutral level of 50, indicating bullish momentum. The Moving Average Convergence Divergence (MACD) indicator on the daily chart also showed a bullish crossover last week, giving buy signals and indicating an upward trend.
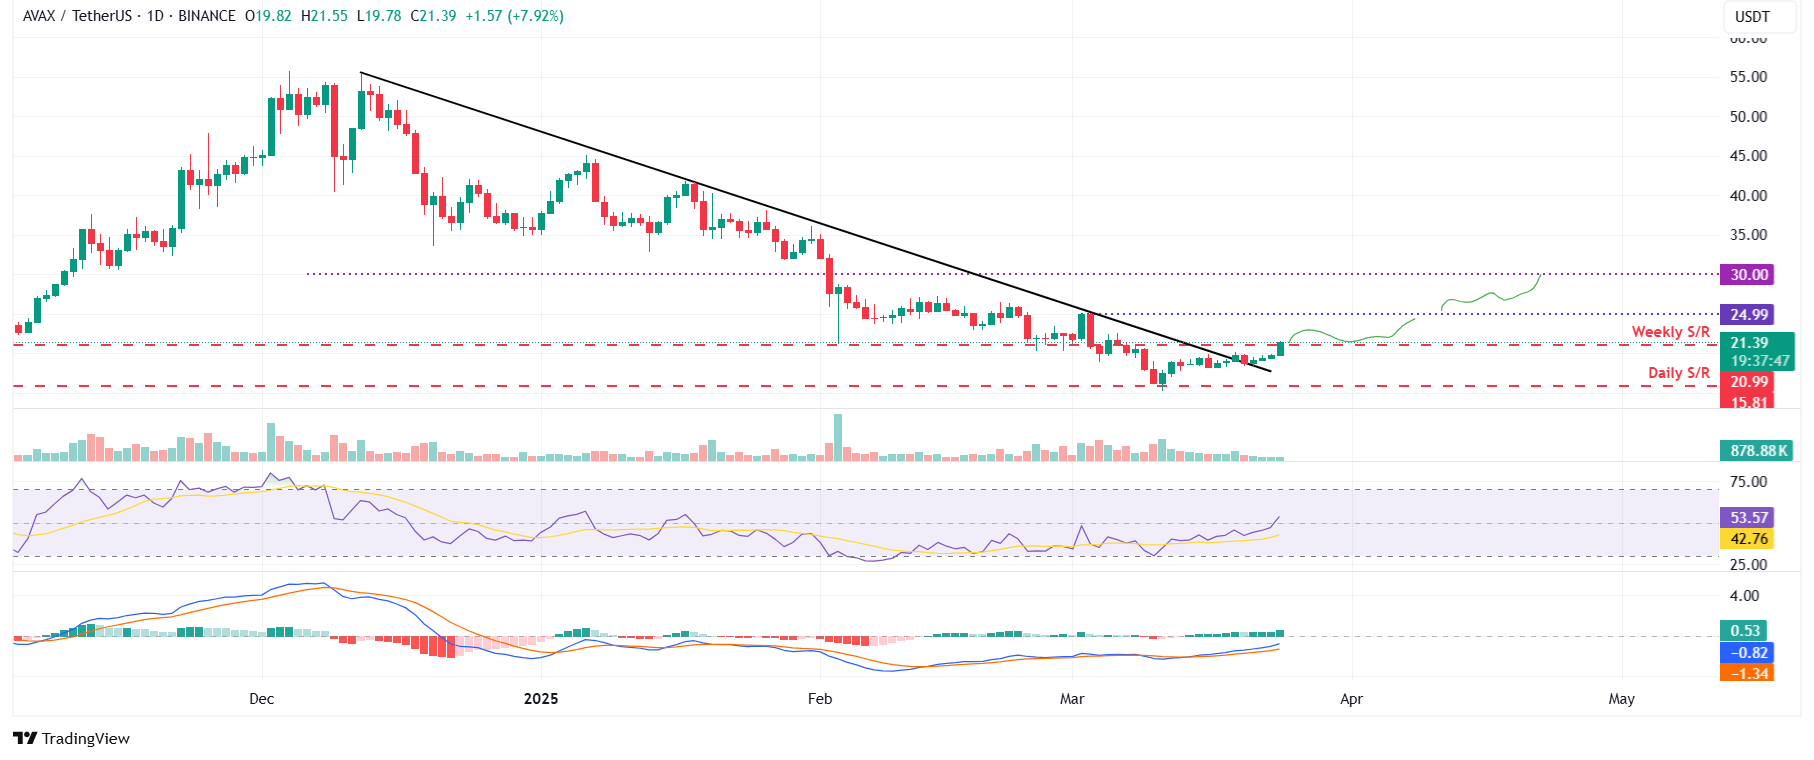
AVAX/USDT daily chart
Another bullish sign is Coinglass’ AVAX long-to-short ratio, which reads 1.18, the highest level in over a month. This ratio above one reflects bullish sentiment in the markets as more traders are betting for the asset price to rise.
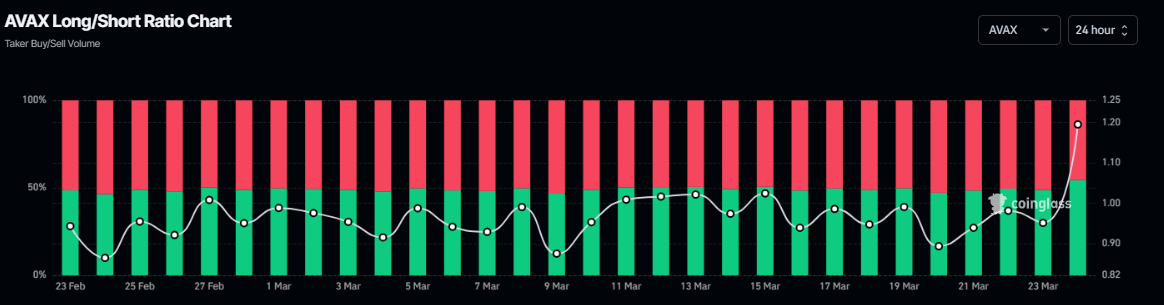
AVAX long-to-short ratio chart. Source: Coinglass
According to Coinglass’s OI-Weighted Funding Rate data, the number of traders betting that the price of Avalanche will slide further is fewer than those anticipating a price increase.
This index is based on the yields of futures contracts, which are weighted by their open interest rates. Generally, a positive rate (longs pay shorts) indicates bullish sentiment, while negative numbers (shorts pay longs) indicate bearishness.
In the case of AVAX, the metric increased from -0.0065% on Friday to 0.0051% on Monday, reflecting a positive rate and indicating that longs are paying shorts. This scenario often signifies bullish sentiment in the market, suggesting potential upward pressure on Avalanche’s price.
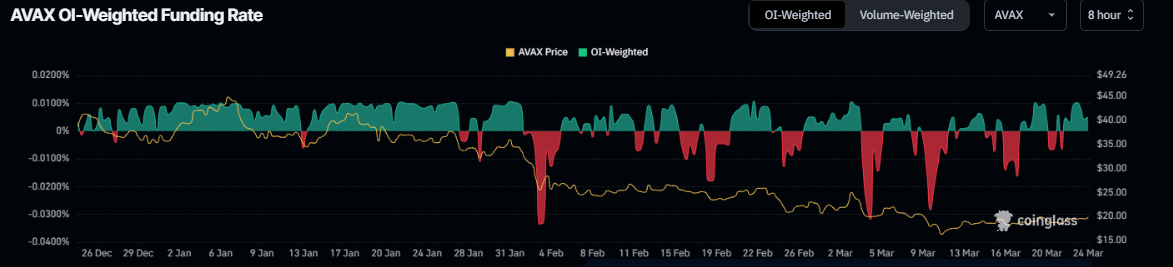
AVAX OI-Weighted Funding Rate chart. Source: Coinglass