- Chainlink price surges around 15% on Thursday, reaching levels not seen since mid-November 2021.
- The rally was fueled by the Donald Trump-backed World Liberty Financial purchase of 41,335 LINK tokens worth $1 million on Thursday.
- Chainlink announced a partnership with Emirates NBD banking group, and Link’s CCIP launched on the Ronin network on Wednesday.
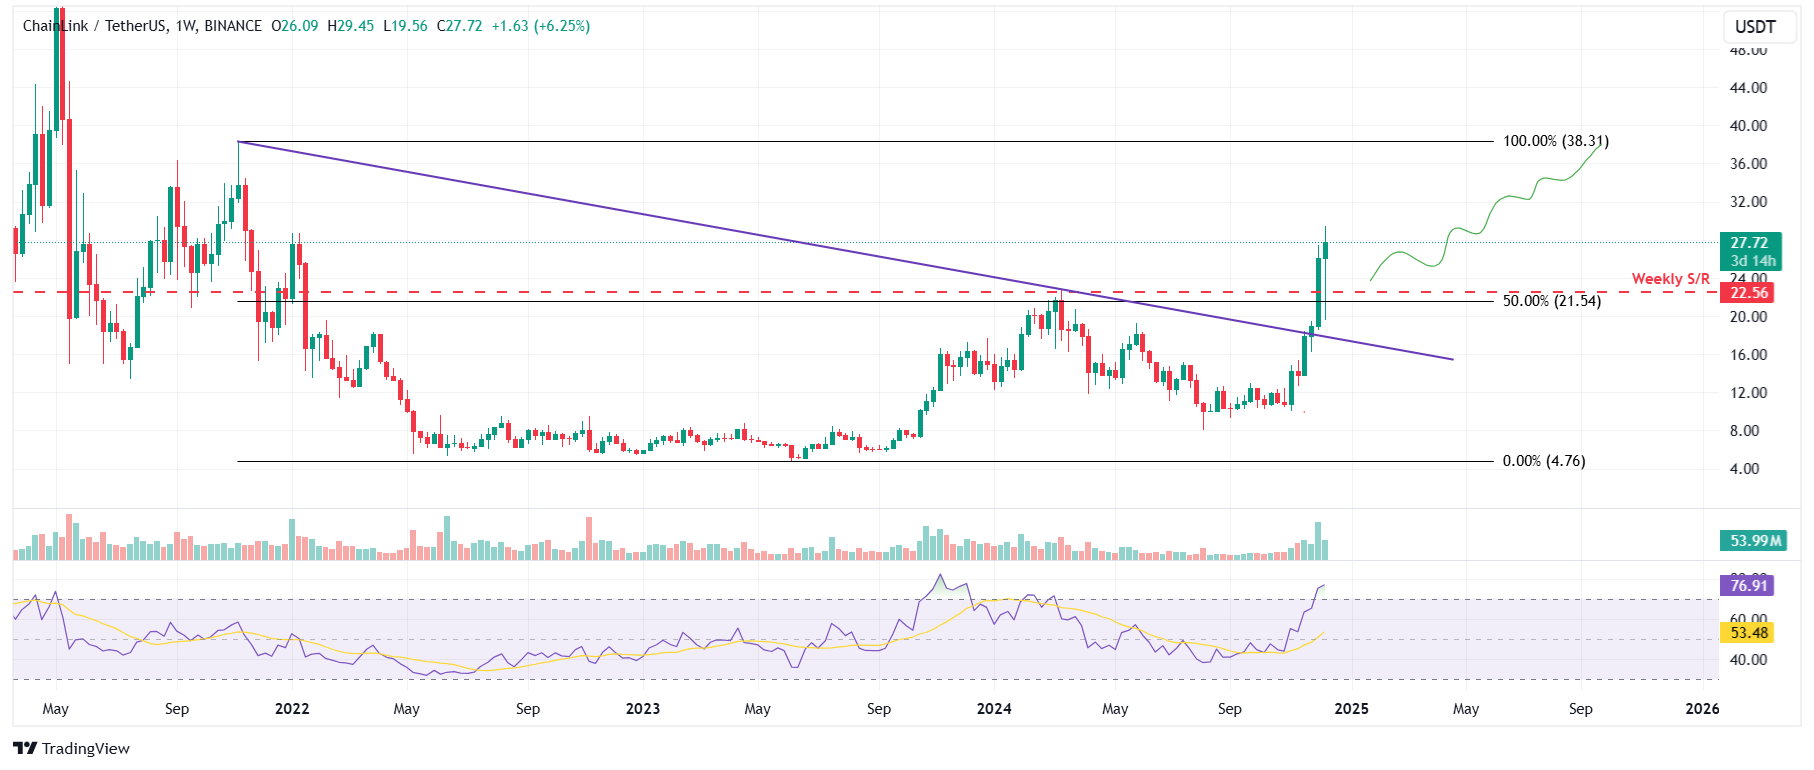
- The technical outlook suggests a continuation of the rally, targeting a three-year high of $38.
Chainlink (LINK) price extends its gains, rallying more than 15% on Thursday and reaching levels not seen since mid-November 2021. The main reasons behind the rally are the purchase of $1 million worth of LINK tokens by the Trump-backed DeFi platform World Liberty, as well as announcements such as the partnership with Emirates NBD banking group and the launch of Link’s Cross-Chain Interoperability Protocol (CCIP) on the Ronin network.
The technical outlook suggests a continuation of the rally, targeting a three-year high of $38.
Why is Chainlink going up today?
Chainlink price extends gains by more than 15% on Thursday after surging almost 38% last week. The main reasons for the recent price surge are:
- Secondly, banking group Emirates NBD announced on Wednesday that Chainlink became a fifth council member of its Digital Asset Lab.
- Third, Chainlink’s Cross-Chain Interoperability Protocol (CCIP) went live on the Ronin network, a leading Web3 gaming ecosystem. The CCIP bridge lanes between Ethereum, Ronin and Base allow users to transfer select tokens between these ecosystems. This also lays a foundation to enable more lanes and even more chains.
- Lastly, on Tuesday, Coinbase’s Project Diamond integrated the Chainlink standard to accelerate digital asset adoption. Institutions can leverage Chainlink to manage the full lifecycle of tokenized assets on the Project Diamond platform.
Technical Outlook: LINK could extend rally towards $38
Chainlink’s weekly chart shows that price action broke decisively above $21.54 last week, a level that aligns with the 50% price retracement level drawn from the November 2021 high of $38.31 to the June 2023 low of $4.76. As of this week, it found support and bounced off the $21.54, and on Thursday, it trades higher around $27.72.
If LINK continues its upward momentum, it could extend the rally to retest its November 2021 high of $38.31.
The Relative Strength Index (RSI) on the weekly chart reads at 77, signaling extremely overbought conditions and suggesting an increasing risk of a correction. Traders should be cautious when adding to their long positions because the chances of a price pullback are increasing.
Still, the RSI is quite stable, so there is also the possibility that the rally continues and the indicator edges further up or remains within the overbought level. A clear sell signal would occur if the RSI decisively exited overbought territory.

LINK/USDT weekly chart


