


- Pepe price breaks out of the descending channel pattern, signaling a change in market structure from bearish to bullish.
- On-chain data shows that PEPE’s Long-to-Short ratio is 1.66, suggesting a bullish bias.
- A daily candlestick close below $0.0000076 would invalidate the bullish move.
PEPE (PEPE) price broke out of a descending channel pattern, surging by 12%, but is currently experiencing a corrective pullback, trading 2.3% lower at $0.0000121 as of Wednesday. On-chain data reveals PEPE’s Long-to-Short ratio stands at 1.66, hinting at potential upcoming rallies for the cryptocurrency.
PEPE price shows potential for a rally
Pepe price broke out of the descending channel pattern on July 15 and rallied 12% in the following four days. This pattern is formed by joining multiple high and low levels with trendlines and a breakout signal as a bullish move. At the time of writing, it trades 2.3% down at the $0.0000121 level.
If the trendline holds as throwback support around the $0.0000108 level, PEPE could rally 29% to retest its daily high of $0.0000139 from June 12.
This potential bounce is supported by indicators like the Relative Strength Index (RSI) and Awesome Oscillator (AO) on the daily chart, both comfortably above their respective neutrality levels of 50 and zero. These momentum indicators indicate strong bullish dominance.
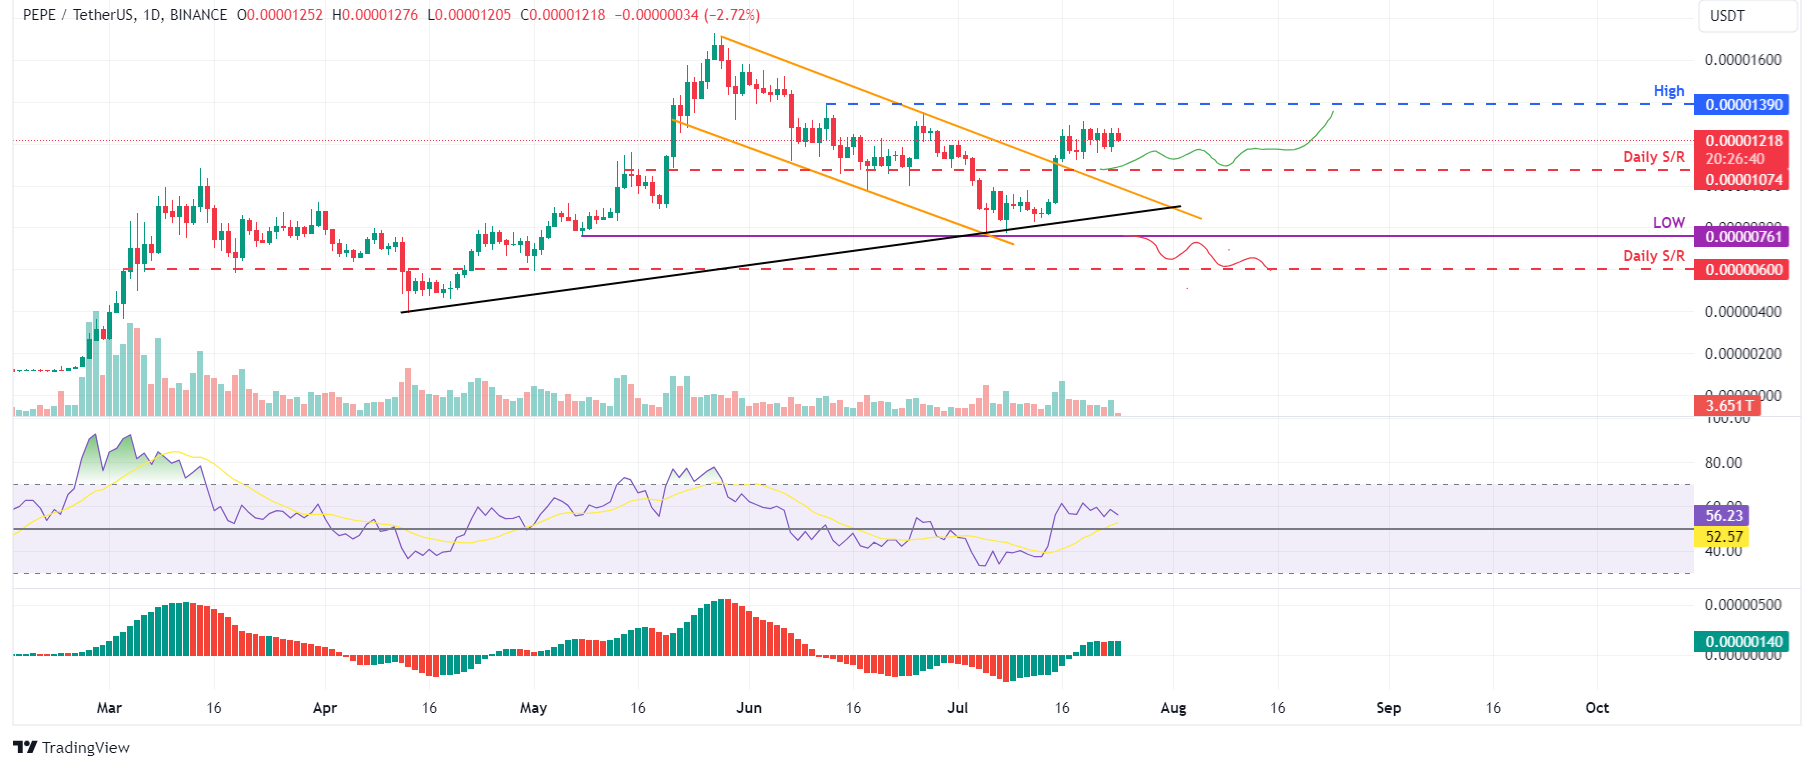
PEPE/USDT daily chart
Based on IntoTheBlock’s In/Out of the Money Around Price (IOMAP), nearly 8,420 addresses accumulated 26.14 trillion frog-based meme tokens at an average price of $0.0000110. These addresses bought PEPE tokens between $0.000011 and $0.0000120, which makes it a key support zone.
Interestingly, the $0.0000110 to $0.0000120 zone mentioned from a technical analysis perspective coincides with the IOMAP findings, making this zone a key reversal area to watch.
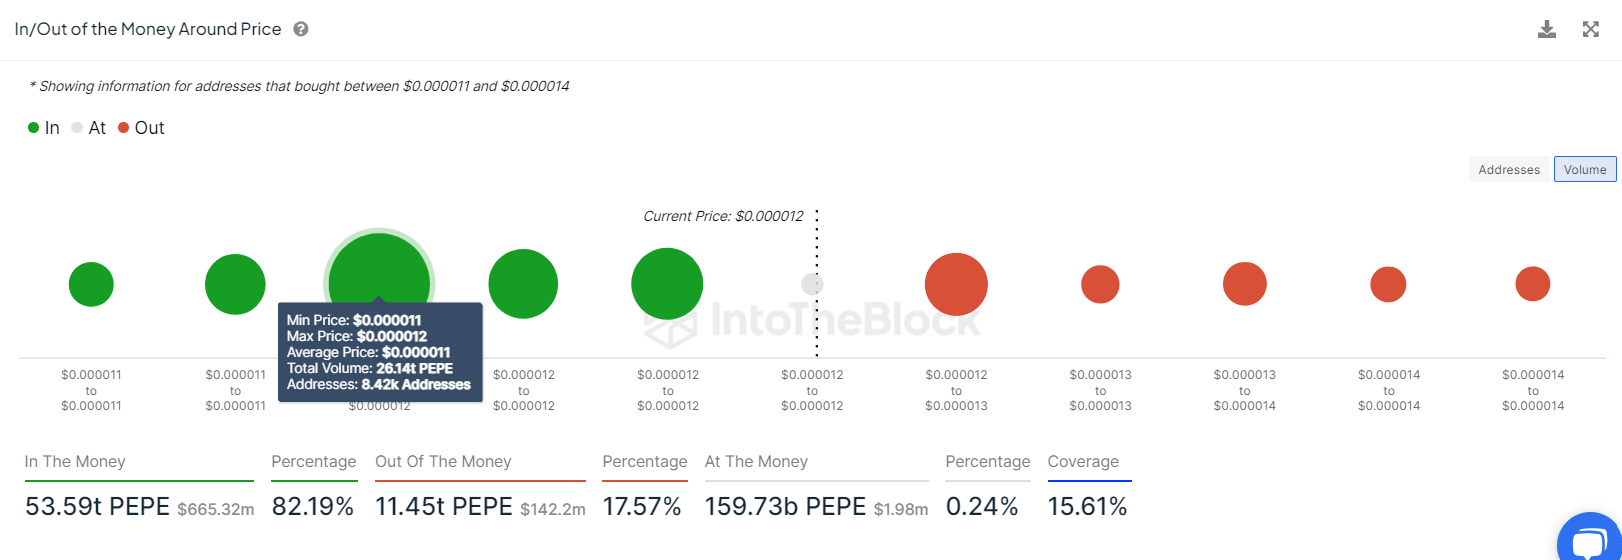
PEPE IOMAP chart
According to Coinglass, the Long-to-Short ratio shows insight into traders’ and investors’ sentiment toward a specific cryptocurrency. A high long-to-short ratio suggests that more traders are betting on the coin’s price increasing (bullish sentiment). In contrast, a low ratio indicates that more traders are betting on decreasing prices (bearish sentiment).
As in PEPE’s case, the Long-to-Short ratio is at 1.66, which suggests that approximately 1.66 times as many long positions are open as short positions, signaling a bullish sentiment by PEPE investors.
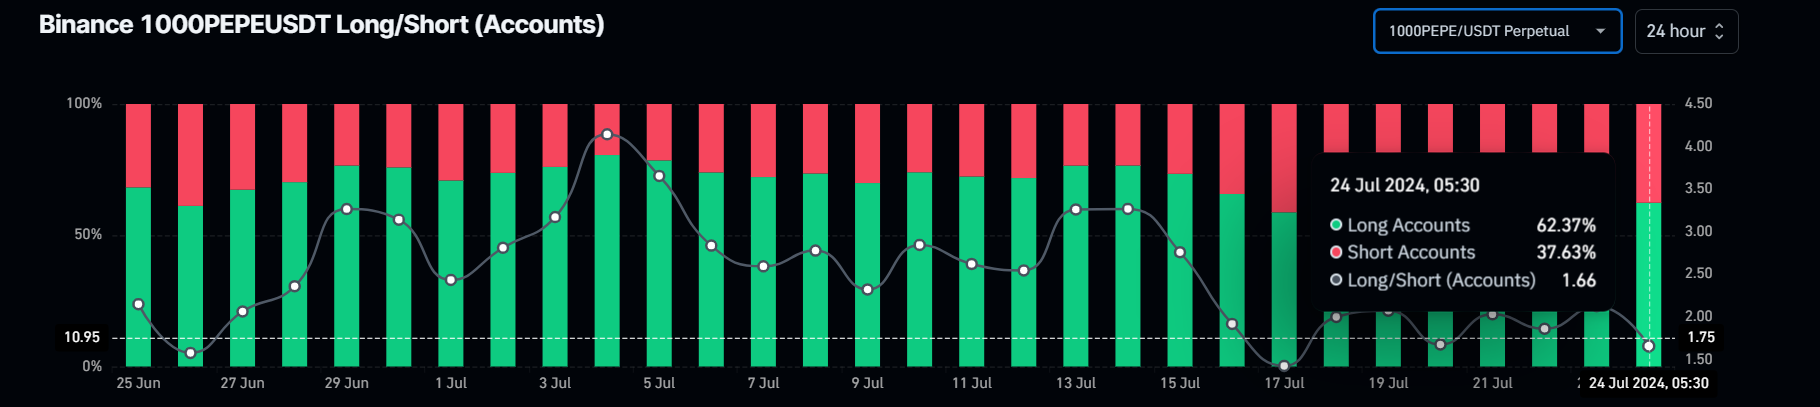
PEPE Long/Short ratio
Even though the on-chain metric and technical analysis point to a bullish outlook, if PEPE’s daily candlestick closes below $0.0000076, this move would invalidate the bullish thesis by producing a lower low on a daily timeframe. This development could see the PEPE price crash by 21% to the daily support level of $0.0000060.