


- Polymesh continues its upward momentum on Tuesday, extending a 5% rally over the past two days.
- Derivatives data paints a bullish picture as POLYX funding rates turn positive, open interest rises, and bullish bets increase.
- The technical outlook suggests potential double-digit gains, making POLYX a standout altcoin despite broader market weakness.
Polymesh (POLYX) continues to extend its gains, trading around $0.132 at the time of writing on Tuesday, after a 5% rally over the past two days. Derivatives data reinforces the bullish sentiment, with POLYX’s funding rates turning positive, open interest climbing and long positions increasing. The technical analysis suggests that POLYX may be poised for double-digit gains on the horizon, making it a key altcoin to watch this week.
POLYX’s derivatives data shows a bullish bias
Coinglass derivatives data show that POLYX Open Interest (OI) surged by nearly 7% in the last 24 hours, reaching $8.70 million. An increased buying activity fuels the OI spike, suggesting heightened optimism surrounding Polymesh. Additionally, its long-to-short ratio also stands at 1.01, indicating that traders are betting on the asset price to rise.
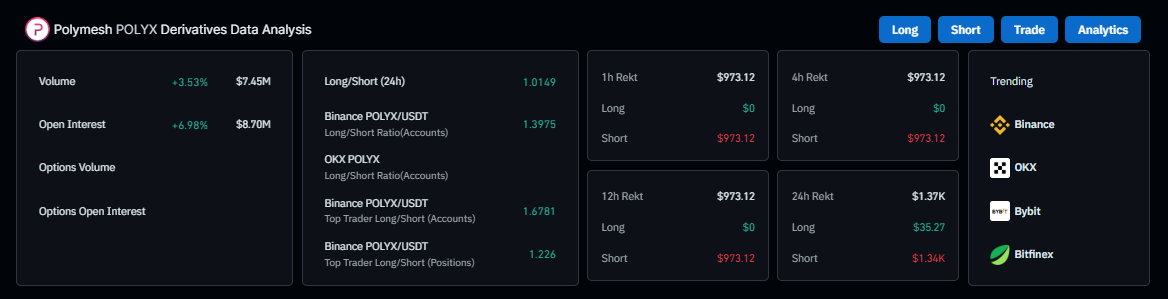
Polymesh derivatives data chart. Source: Coinglass
Coinglass’s OI-weighted Funding Rate data shows that the metric has flipped to a positive rate, reading 0.0097% on Tuesday, indicating that longs are paying shorts. Historically, as shown in the chart below, when the funding rates have flipped from negative to positive, POLYX’s price has generally rallied sharply.
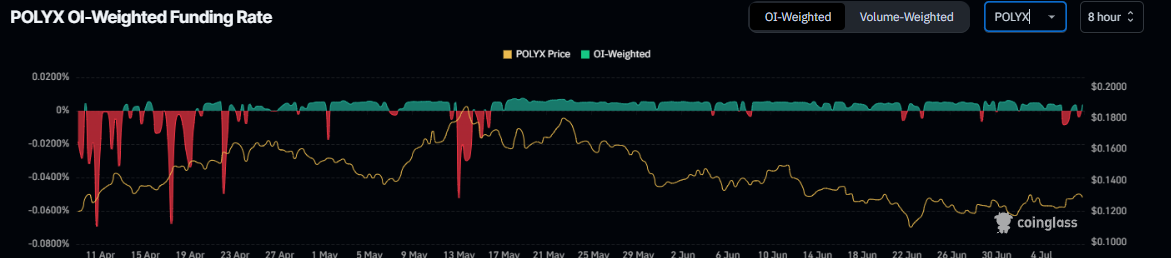
Polymesh funding rate chart. Source: Coinglass
Polymesh’s technical outlook suggests a double-digit gain
Polymesh price broke above a descending trendline (drawn by connecting multiple highs since mid-May) on Sunday and rallied by nearly 5% until the next day. At the time of writing on Tuesday, it continues to trade higher by 2.2% at around $0.132.
If POLYX continues its upward momentum, it could extend the rally by nearly 10% from its current levels to retest the 100-day Exponential Moving Average (EMA) at $0.146.
The Relative Strength Index (RSI) on the daily chart reads 53 and points upwards, indicating that bullish momentum is gaining traction. Additionally, the Moving Average Convergence Divergence (MACD) indicator showed a bullish crossover on June 28. It also shows rising green histogram bars above its neutral zero line, suggesting bullish momentum is gaining traction and continuing an upward trend.
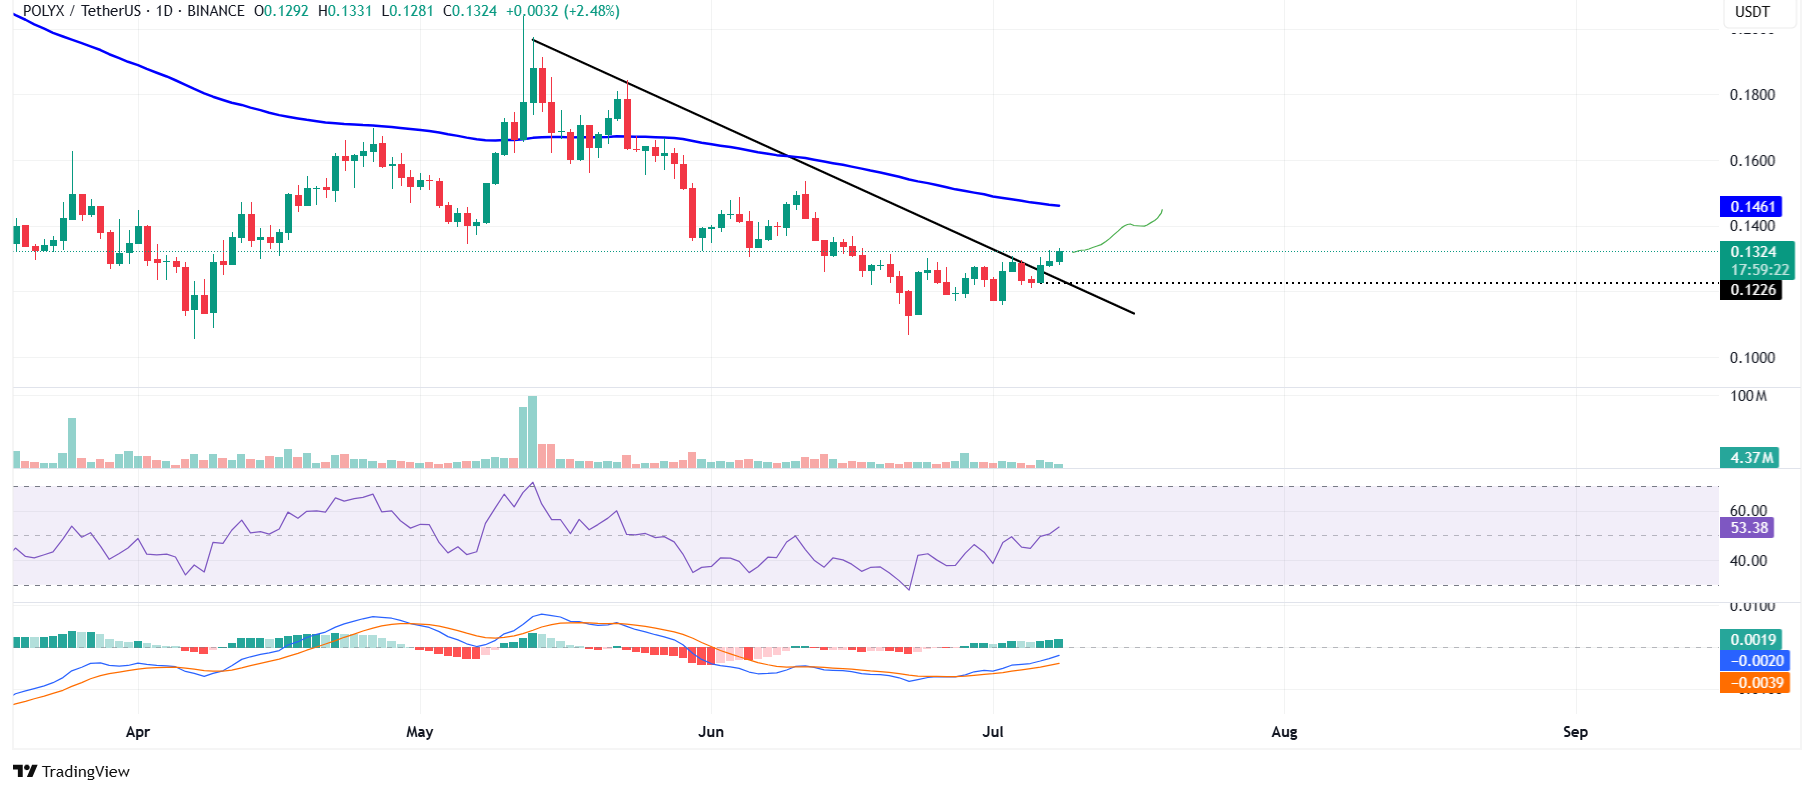
POLYX/USDT daily chart
However, if Polymesh faces a correction, it could extend the decline to retest its Sunday low at $0.122.