- Ripple price broke below the ascending trendline, indicating a shift in market structure from bullish to bearish.
- On-chain data paints a downward trend, as XRP shows a spike in NPL and a decreasing daily trading volume.
- A daily candlestick close above $0.554 would invalidate the bearish thesis.
Ripple (XRP) price stabilizes around $0.530 and trades within a tight range for the fourth day in a row on Tuesday. After breaking below its ascending trendline last week, XRP’s price was rejected from its daily resistance level on Monday. This bearish price action is further supported by on-chain data, which show a spike in the Network Realized Profit/Loss (NPL) metric and a decrease in daily trading volume, hinting at a decline ahead.
Ripple price set for a downward trend
Ripple price broke below an ascending trendline (drawn by connecting multiple lows since early July) on October 2 after being rejected from the July 31 high at the end of September. A breakdown like this generally shows a market structure change from bullish to bearish.
Moreover, XRP also closed below two crucial support levels: the 200-day Exponential Moving Average (EMA) at $0.554 and the daily support level at $0.544. On Monday, XRP was rejected for the daily level at $0.544 and is currently trading below it, at around $0.528.
If the 200-day EMA at $0.554, which roughly coincides with the ascending trendline, acts as resistance, XRP could decline 18% from its current trading level to retest the August 5 low of $0.431.
The Moving Average Convergence Divergence (MACD) on the daily chart shows a bearish crossover on October 2, giving a sell signal. It also shows red histograms below its neutral level, indicating that the momentum is in the bear’s control.
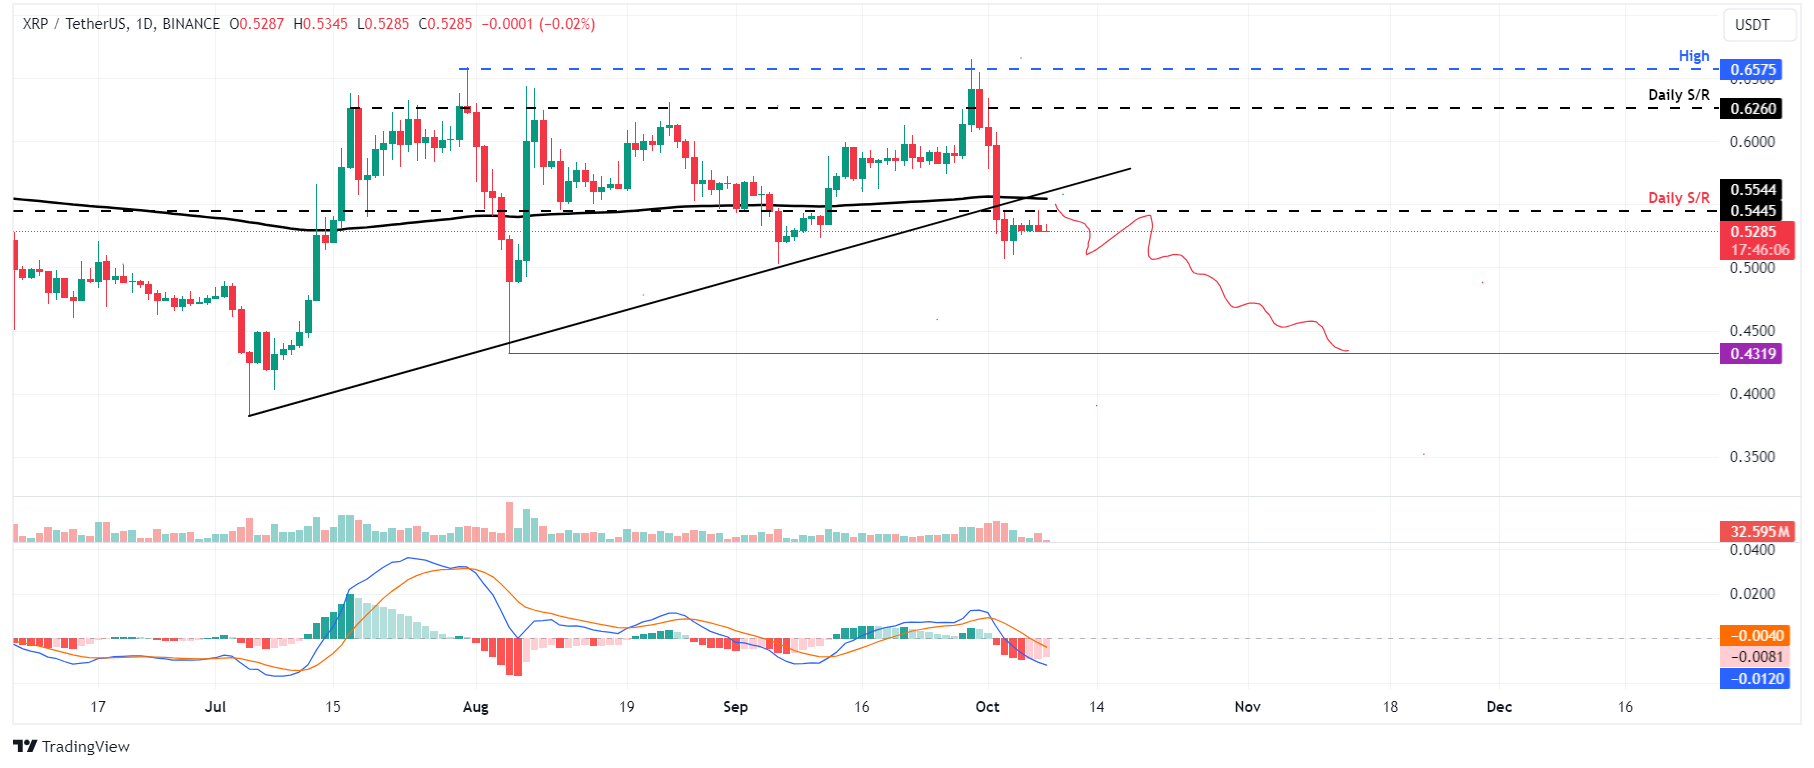
XRP/USDT daily chart
Ripple’s Network Realized Profit/Loss (NPL) indicator also aligns with the bearish outlook. This metric computes a daily network-level Return On Investment (ROI) based on the coin’s on-chain transaction volume. Simply put, it is used to measure market pain. Strong spikes in a coin’s NPL indicate that its holders are, on average, selling their bags at a significant profit. On the other hand, strong dips imply that the coin’s holders are, on average, realizing losses, suggesting panic sell-offs and investor capitulation.
In XRP’s case, the NPL indicator spiked from 13.24 million to 146.09 million from September 30 to October 1. This uptick indicates that the holders were, on average, booking their profits and increasing the selling pressure.
%20%5B11.18.31,%2008%20Oct,%202024%5D-638639693976515460.png)
XRP Network Realized Profit/Loss chart. Source: Santiment
Additionally, XRP’s daily trading volume aligns with the bearish outlook. From October 2 to Sunday, Ripple’s daily trading volume fell from $3.13 billion to $704.78 million, the lowest since early September. This fall indicates a decrease in traders’ interest and liquidity in the Ripple blockchain.
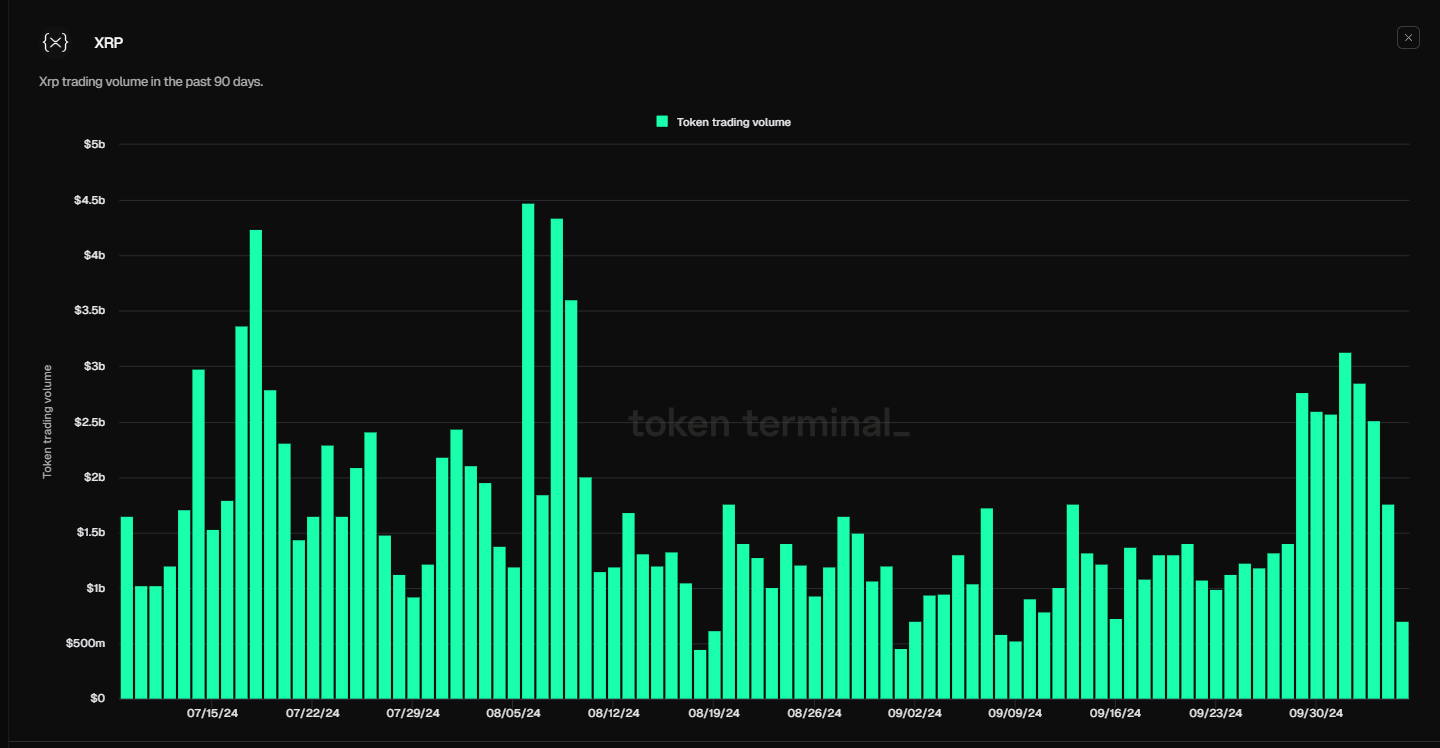
XRP trading volume chart. Source: Token Terminal
However, if XRP breaks and closes above the $0.554 level, it could extend the rise by 13% to retest its next daily resistance at $0.626.