- Altcoins led by Flare, Ondo and Bittensor surge on Thursday as markets welcome President Trump’s tariff pause.
- Bitcoin rally falters as traders quickly book profits amid Trump’s constantly changing tariff policy.
- Bittensor flaunts a falling wedge pattern with a potential 50% breakout.
Altcoins make stunning recoveries on Thursday following United States (US) President Donald Trump’s sudden U-turn on reciprocal tariffs less than 24 hours after they took effect on Wednesday. Flare (FLR) leads the bullish camp and trades at $0.0145 at the time of writing, following a 26% increase in the past 24 hours. Ondo and Bittensor (TAO) rally alongside other altcoins, with impressive gains of 18.37% and 20% in the same period, and are exchanging hands at $0.8580 and $236, respectively.
Can altcoins outperform Bitcoin in Q2?
The cryptocurrency market has been in a downtrend since the onset of President Trump’s regime’s tariff war. Bitcoin (BTC) dropped to $74,508 on Monday, marking the lowest level since November.
Trump’s sudden U-turn on tariffs, which will effect a 90-day pause except for China, which will have to deal with a 104% tariff, handed global markets a lifeline during the late American session on Wednesday and the Asian session on Thursday.
However, the rally fizzled out quickly after Bitcoin tagged weekly highs of $83,588. The largest cryptocurrency by market capitalization teeters at $82,200 at the time of writing on Thursday after recovering 7.4% in the last 24 hours.
Whether Bitcoin will continue the rally to $90,000 depends on macroeconomic factors. Despite the pause on tariffs on dozens of countries, financial experts warn that they could leave a lasting impact on the US economy.
In the meantime, altcoins posted the largest recovery margins, led by Flare, Ondo and Bittensor in the top 200 cryptocurrencies. Despite the surge in altcoins, Bitcoin’s dominance recovered to 62%, representing $1.63 trillion in market capitalization.
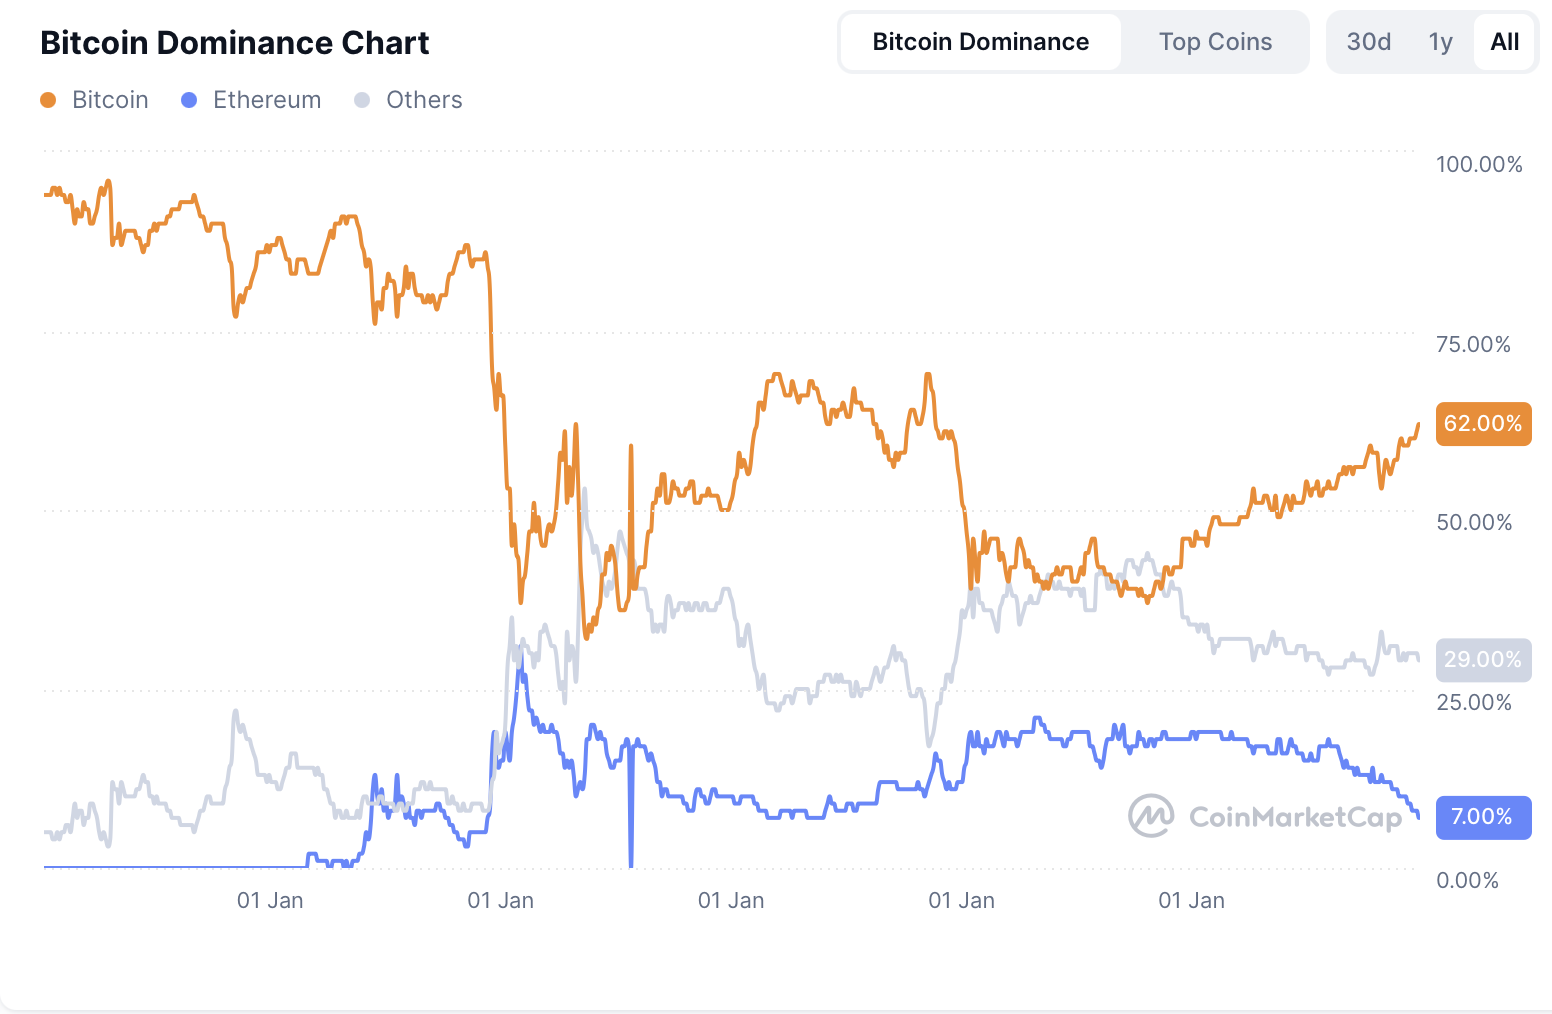
Bitcoin Dominance chart | Source: CoinMarketCap
Flare defends descending channel support
Flare leads the bullish brigade after President Trump’s tariff pause on Wednesday. The token bounced from channel support at $0.0108, as observed in the daily chart below, before coming to a halt at $0.0187, slightly below the channel’s upper resistance.
A buy signal from the Moving Average Convergence Divergence (MACD) indicator validated the upswing. This manifested as the MACD line (blue) crossed above the signal line (red). The Relative Strength Index (RSI), which had dropped to 25.64 in the oversold region, recovered above the mean line, affirming the growing bullish sentiment among traders.
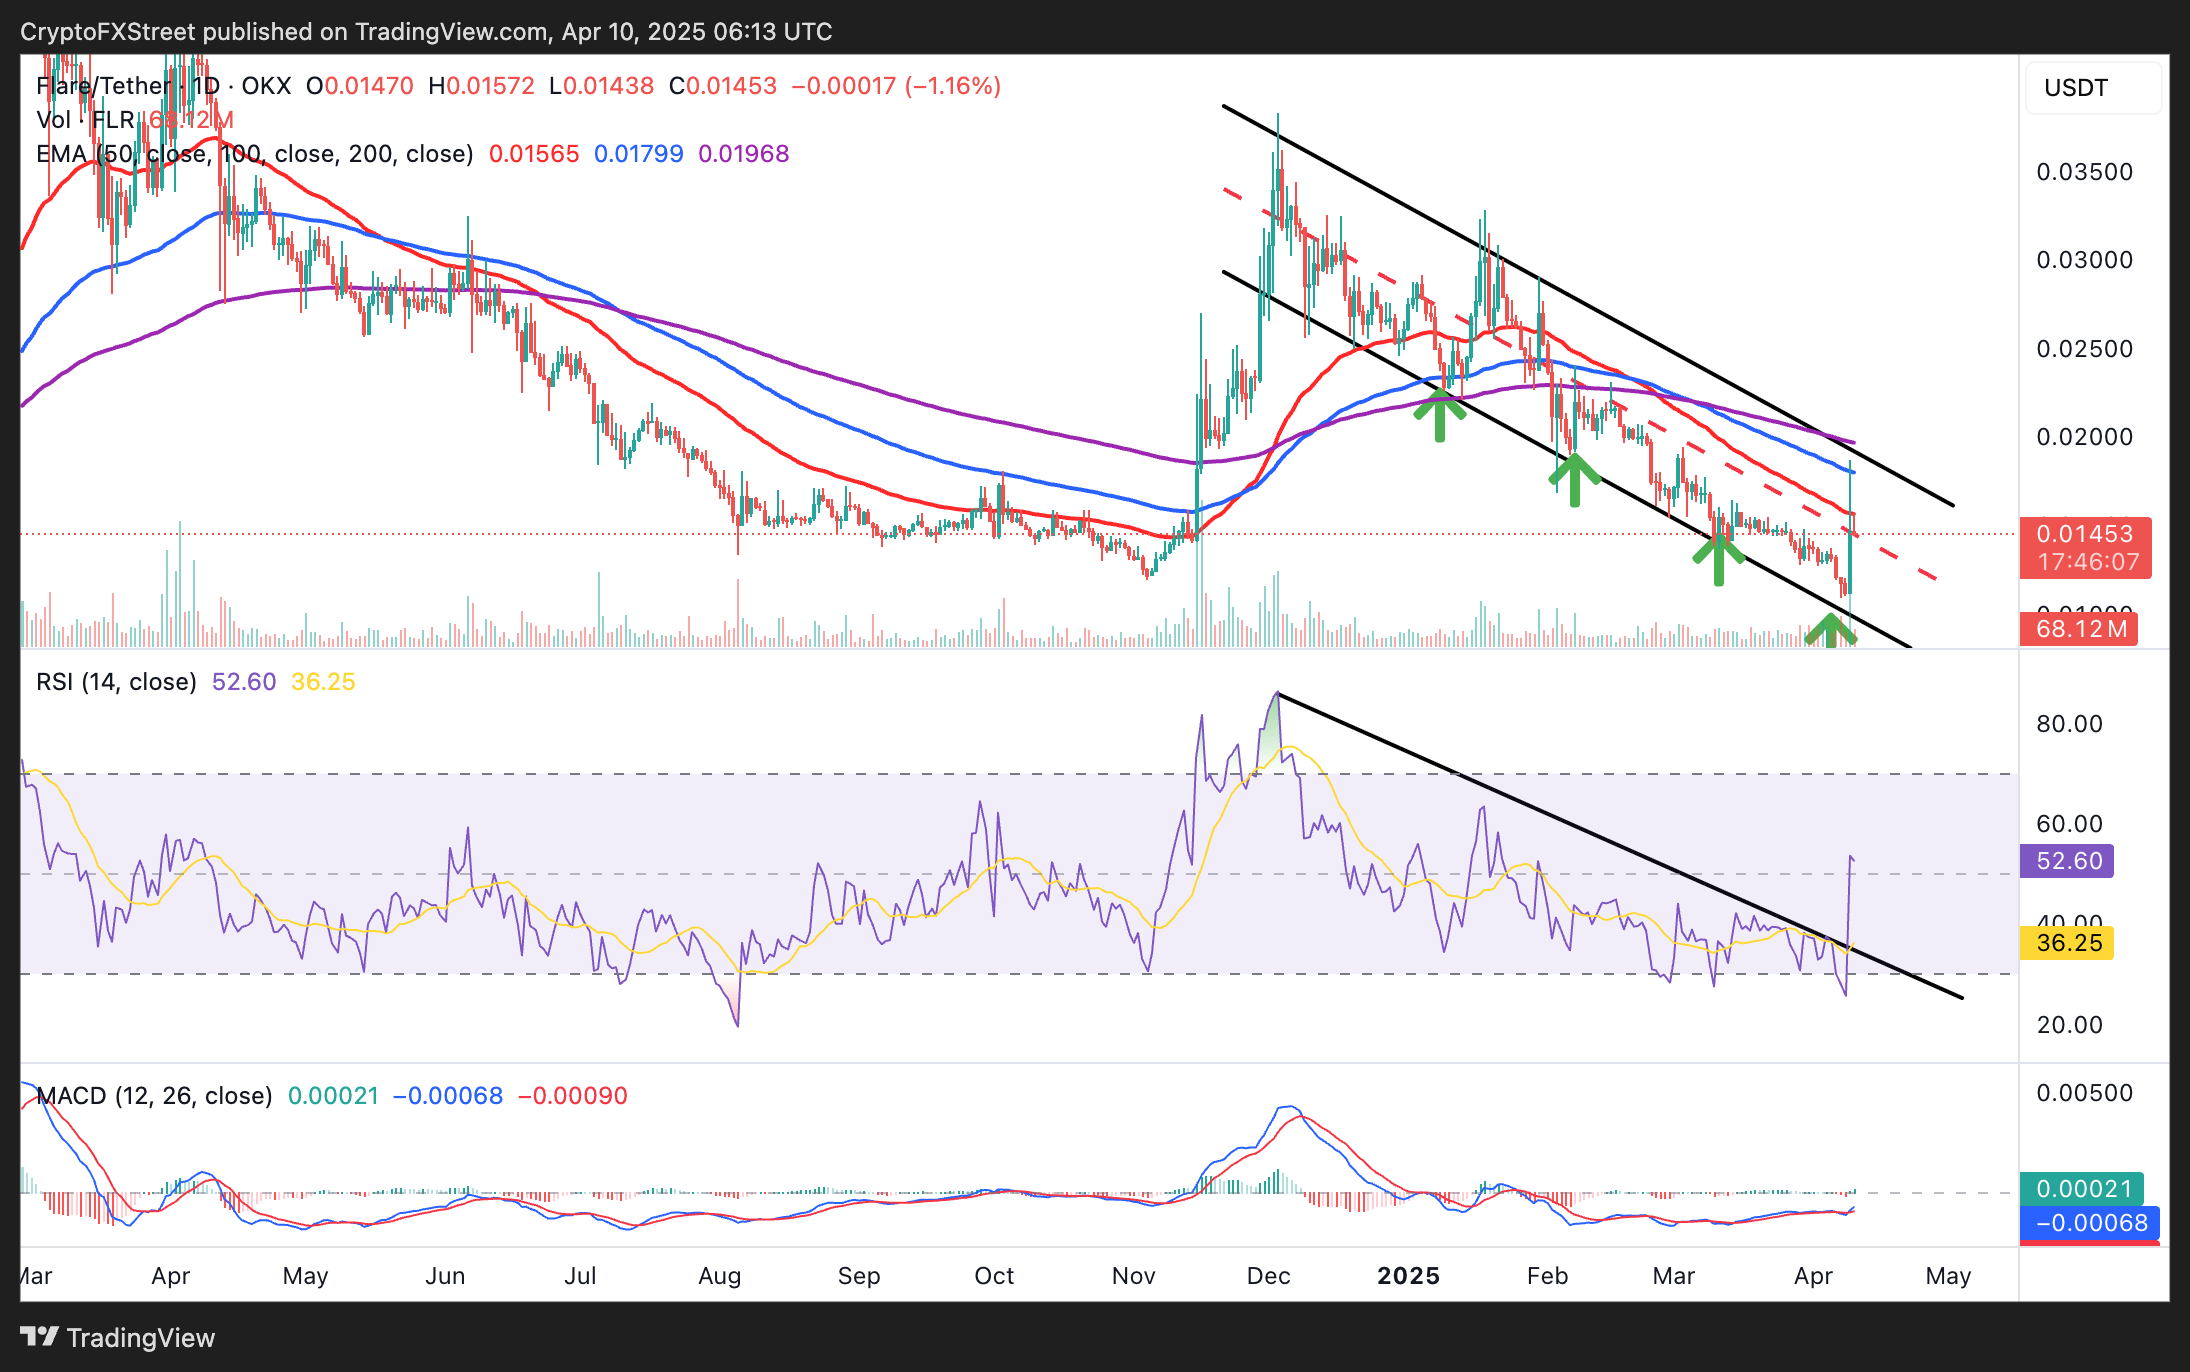
FLR/USD daily chart
Flare now seeks support at the channel’s midline near $0.0145 after losing the tentative support area highlighted by the 50-day Exponential Moving Average (EMA) at $0.0156. Bulls could push Flare to breach the channel’s resistance if they uphold their grip on the asset.
It is important to realize that the downtrend in the descending channel is strong and may not be easily broken amid changing macroeconomic factors. Therefore, prepare for all eventualities, including a correction to $0.0108 support.
Is Ondo price bottom in sight?
Like many cryptocurrencies, Ondo is in the green, hovering at $0.8500 at the time of writing on Thursday. The token sits above the descending channel’s middle line, eyeing a breakout above the upper resistance near the 50-day EMA at $0.9223.
The chart shows that the RSI’s breach of the trendline resistance points to a developing bullish structure. Subsequently, a buy signal from the MACD calls for traders to consider taking on more long positions in ONDO.
If Ondo breaks the channel resistance, attention will shift to $1.4725, which represents a significant hurdle tested in June 2024.
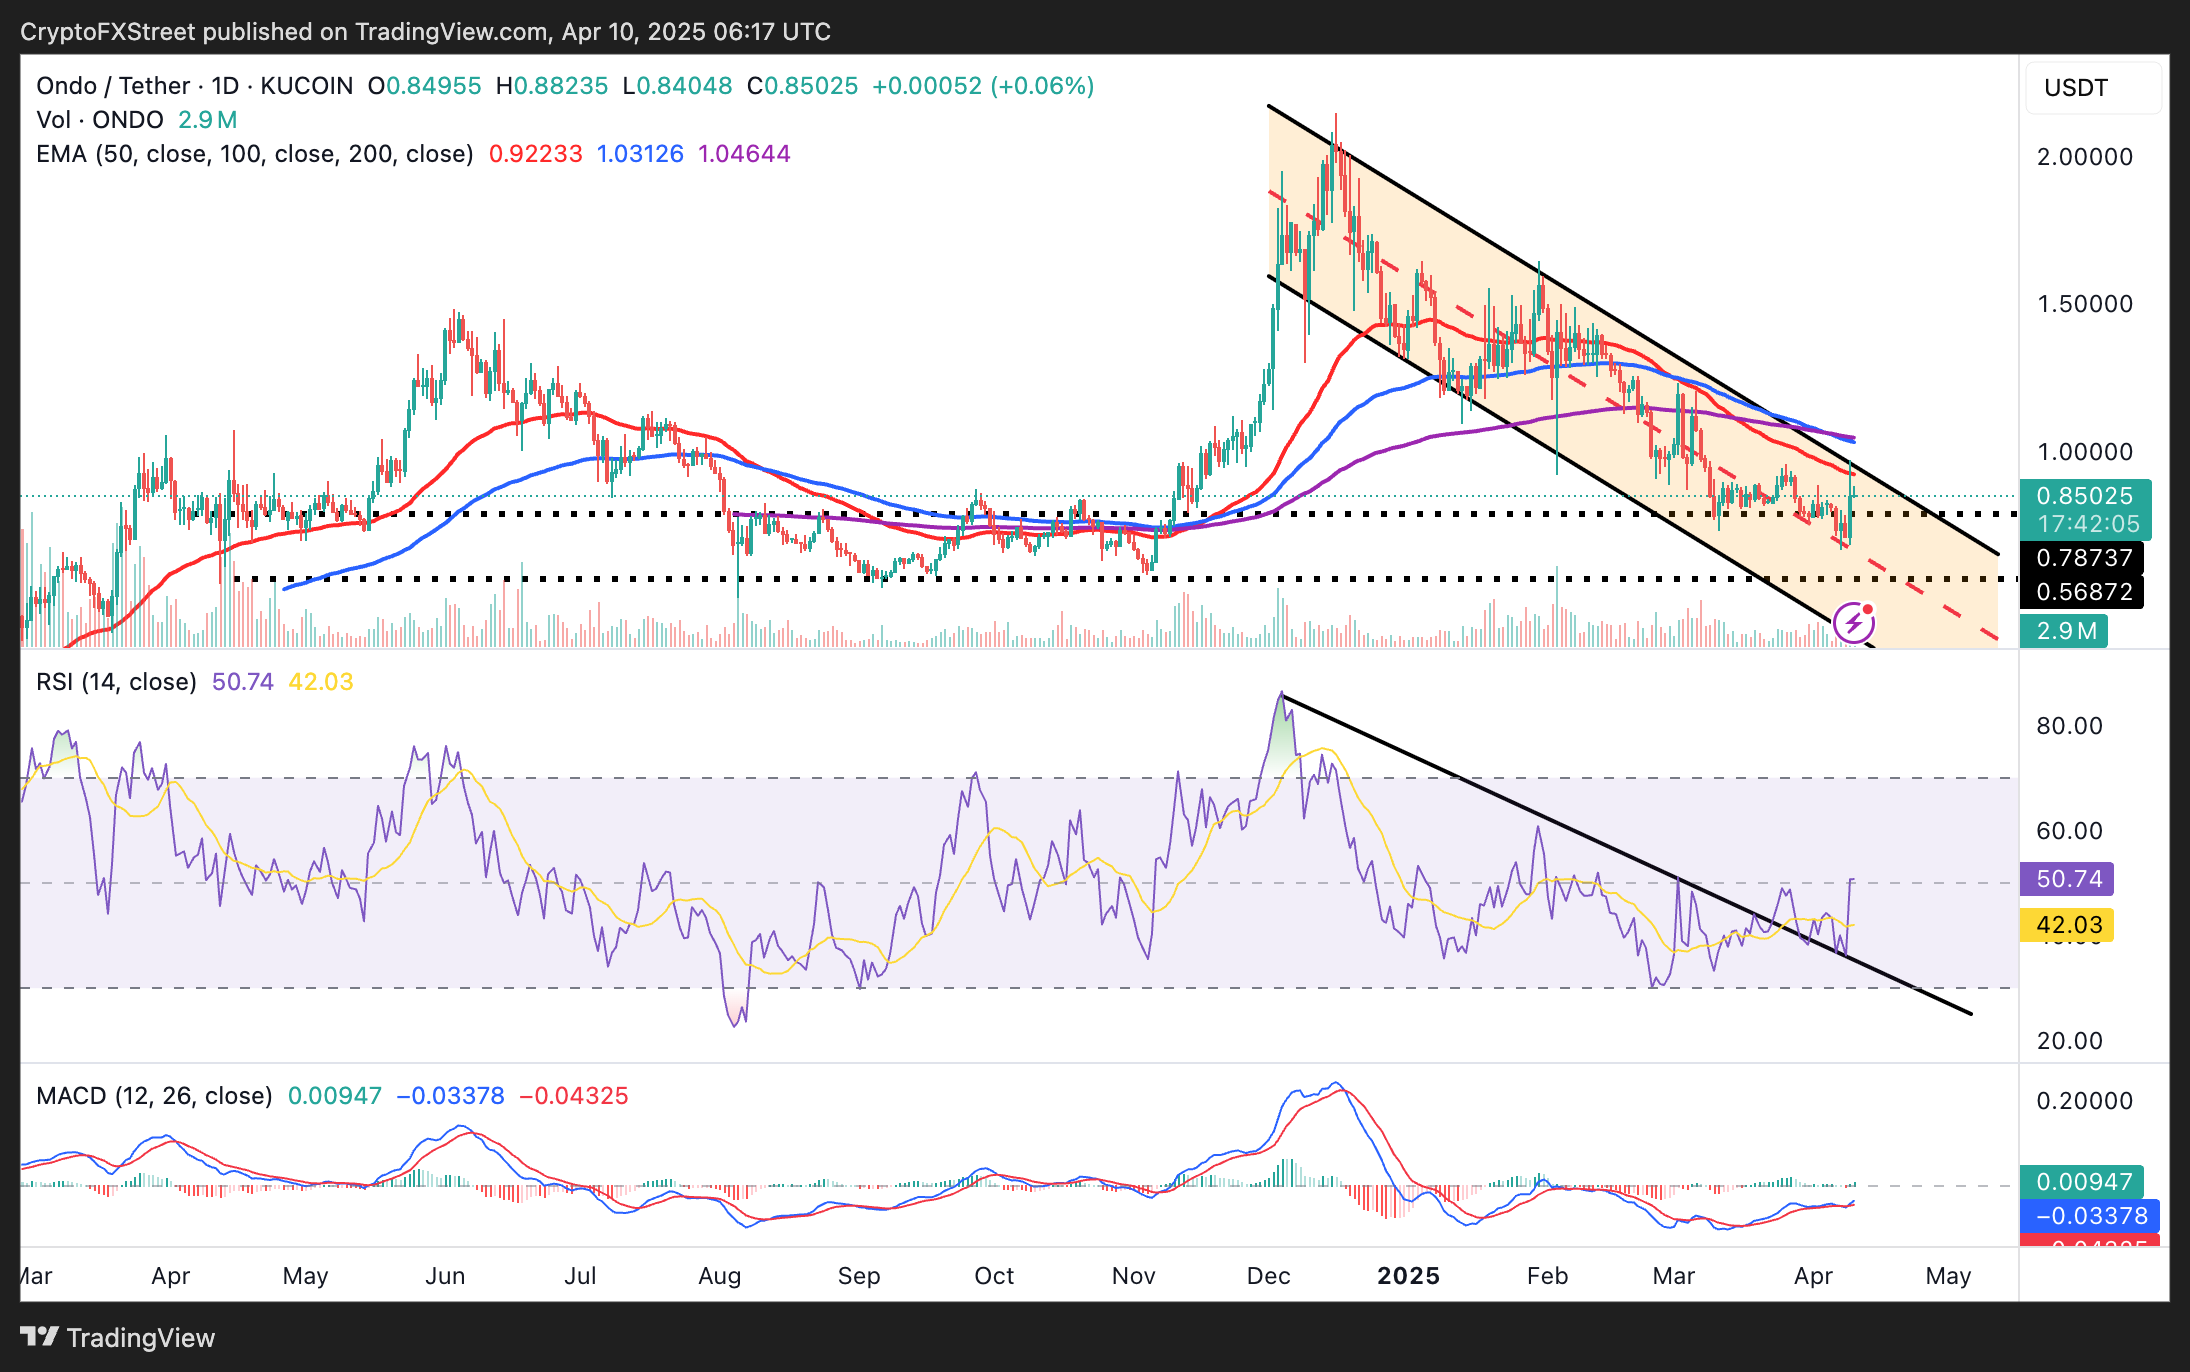
ONDO/USDT daily price chart
However, the 50-day EMA and the channel’s resistance mark Ondo’s biggest immediate obstacles. Failure to break this area may turn the tables, triggering another sell-off as traders take profits. The sell-side pressure may cause Ondo to retest the channel’s middle line or extend the leg to the pattern’s lowest support, around $0.5687, tested in August, September and November 2024.
Bittensor eyes falling wedge pattern breakout
Bittensor, an Artificial Intelligence (AI) token, defended $175 support amid Monday’s tariff-triggered sell-off. The pause on tariffs encouraged traders to buy the dip, creating bullish momentum behind the token. TAO surged above $200 and extended gains to trade at $236 at the time of writing on Thursday.
Bullish sentiment from a MACD buy signal and an upward-sloping RSI nearing its neutral level show that Bittensor is gradually preparing for a falling wedge pattern breakout, likely to push TAO 50% above the breakout point, targeting $393. This target represents the distance between the wedge’s widest points.
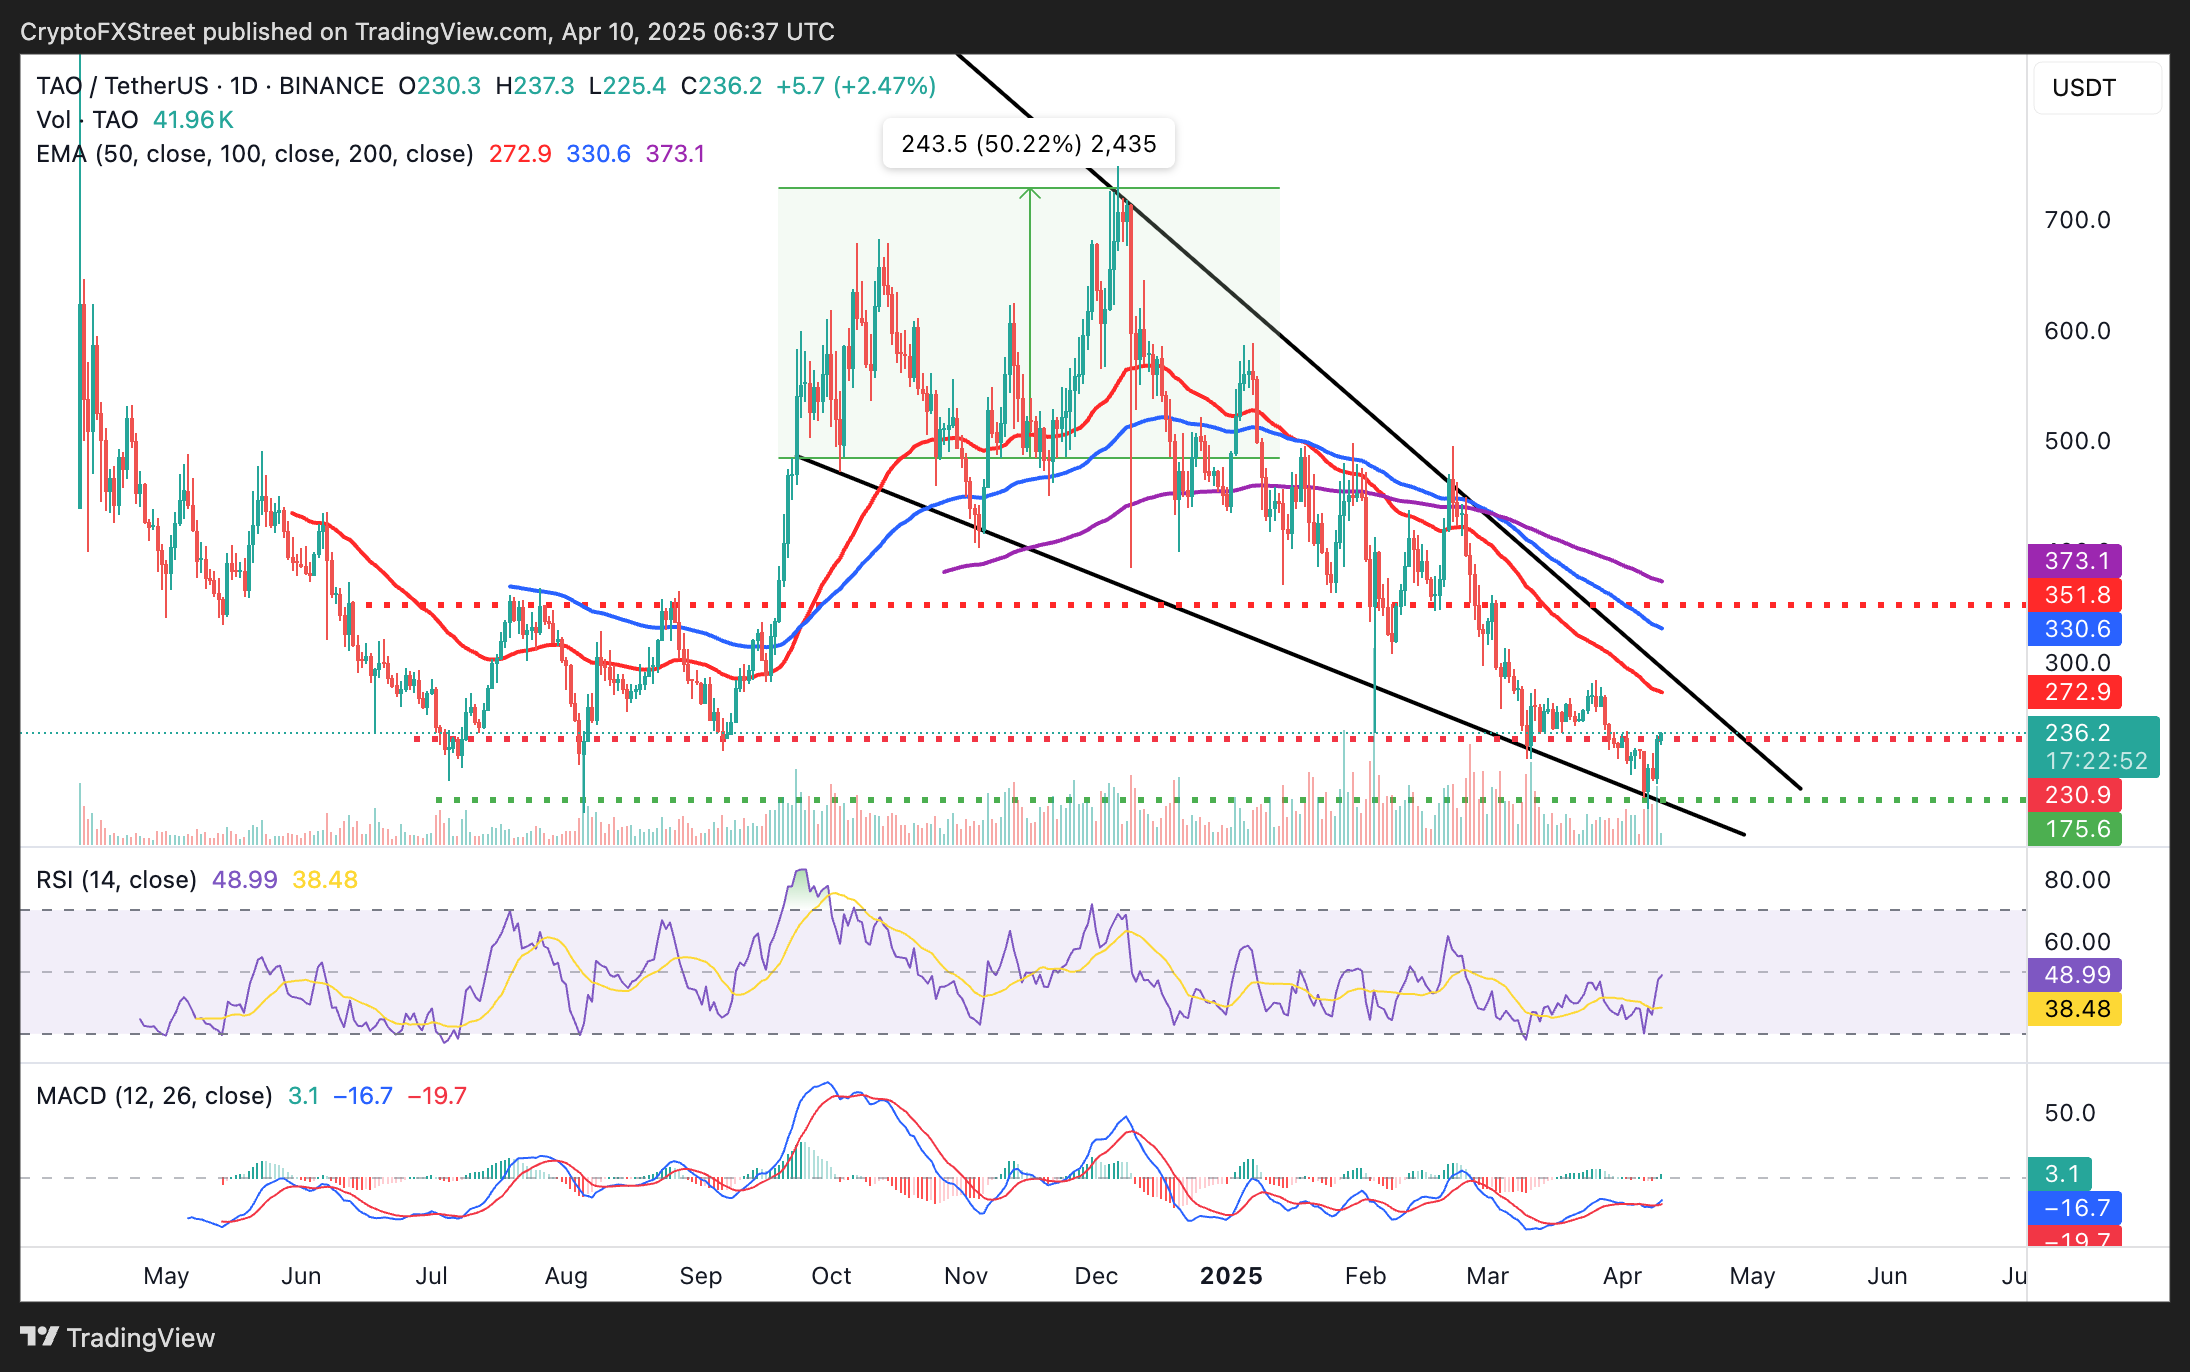
TAO/USDT daily chart
The 50-day EMA, at $272, could challenge Bittensor’s bullish structure, as could the 100-day EMA at $330 and the 200-day EMA at $373. On the downside, the key support area to remember is $175, tested on Monday in July and August 2024.