


- Bitcoin price stabilizes at around $82,000 on Thursday after recovering 8.25% the previous day.
- Crypto markets recover as US President Trump announces 90-day tariff pause.
- Total liquidation reached $589 million on Wednesday, with shorts amounting to $374 million.
- US spot Bitcoin ETFs recorded an outflow of $127.12 million on Wednesday.
Bitcoin (BTC) price stabilizes at around $82,000 on Thursday after recovering 8.25% the previous day. US President Donald Trump’s announcement of a 90-day tariff pause on Wednesday triggered a sharp recovery in the crypto market. This recovery brought in liquidations, reaching $589 million on Wednesday, with the short position liquidation amounting to $374 million. Despite this price revival, the US spot Bitcoin Exchange Traded Funds (EFTs) demand continues to weaken, recording over $127 million outflows on that day.
Bitcoin recovers as Trump pauses tariff policy
Trump’s tariff uncertainty added volatility in the cryptomarket at the start of the week, and BTC reached a new year-to-date low of $74,508 on Monday. However, Bitcoin’s price recovered more than 8%, reaching a high of $83,588 and closing above $82,600 on Wednesday.
This recovery was fueled by the announcement that the US would pause reciprocal tariffs for 90 days. The announcement came one week after Trump had initially announced reciprocal tariffs on over 180 countries.
The recovery rally triggered a wave of liquidations in the crypto market. According to the Coinglass data below, the liquidation amount reached $589 million on Wednesday, and the liquidation amount for the short position was $374 million.
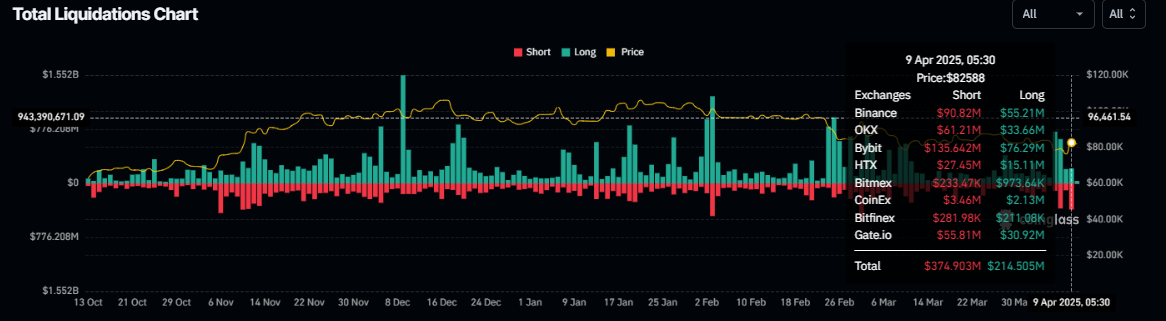
Total Liquidation Chart. Source: Coinglass
Institutional demand for Bitcoin continues to weaken
Looking at the institutional flows, it continues to weaken. According to the SoSoValue data, the US spot Bitcoin ETFs record a net outflow totaling $562.60 million so far this week and a $127.12 outflow only on Wednesday. If the net outflow continues and intensifies, Bitcoin’s price could see further correction ahead.
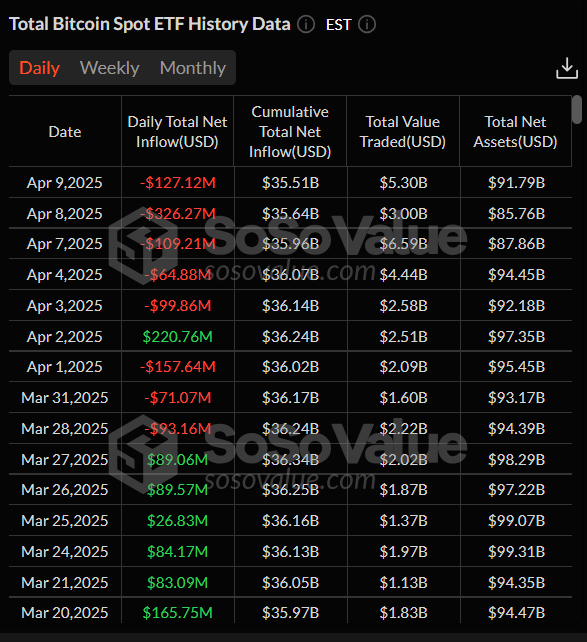
Total Bitcoin Spot ETF daily netflow chart. Source: SoSoValue
Some signs of optimism
Despite an aggressive market drawdown and weakening institutional demand for Bitcoin this week, the Glassnode weekly report highlights some signs of optimism.
The report evaluates the 6-hour rolling window for realized losses to better understand market participants’ behavior and disposition in the current downturn. Investor capitulation events for Bitcoin have been sizeable, with a peak of $240 million in losses locked in across the 6-hour window. This is similar to some of the largest loss events of the cycle. However, the magnitude of losses realized during this drawdown has decreased with each successive price leg lower. This suggests a form of near-term seller-exhaustion may be starting to develop within this price range.
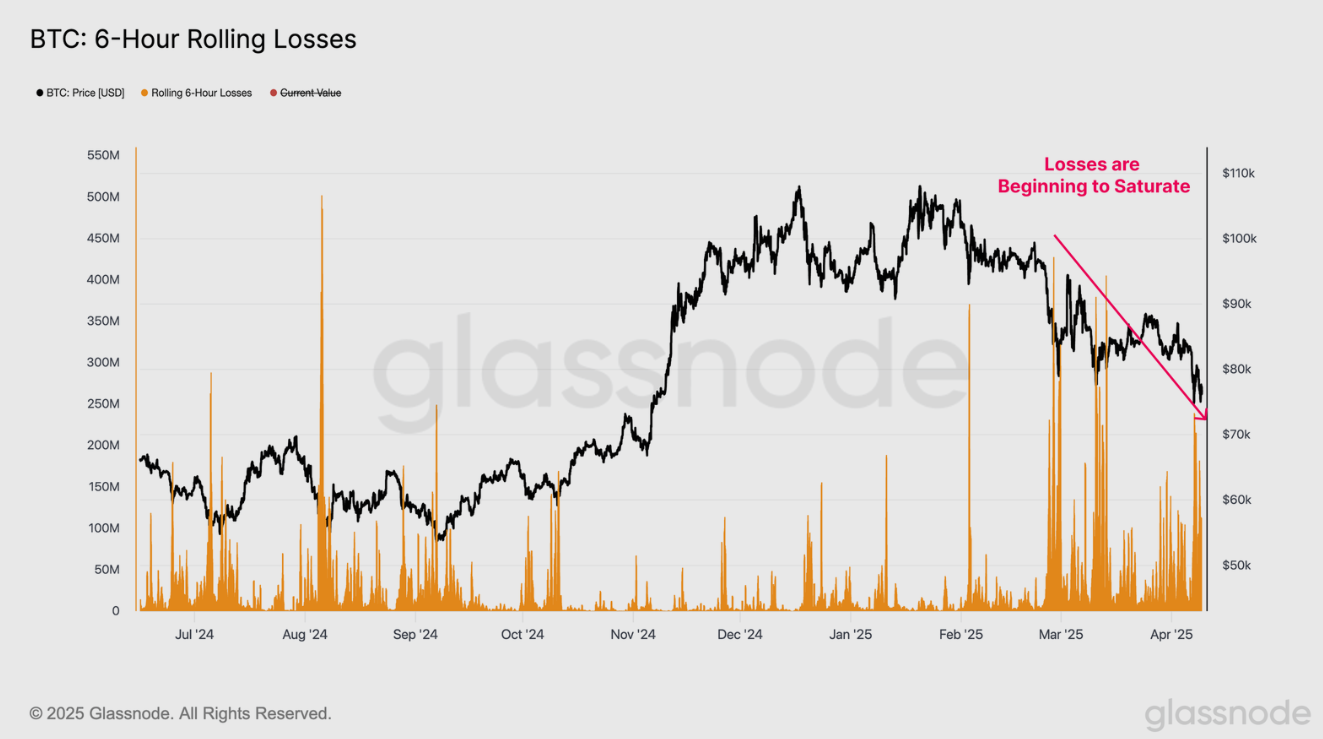
BTC: 6-hour rolling losses chart. Source: Glassnode
The report further explains that using both on-chain and technical price models, the $65,000 to $71,000 region emerges as a key area of interest for the bulls to re-establish long-term support. If Bitcoin prices fall below this, sentiment will likely take a large hit, as a supermajority of active investors will be underwater on their holdings.
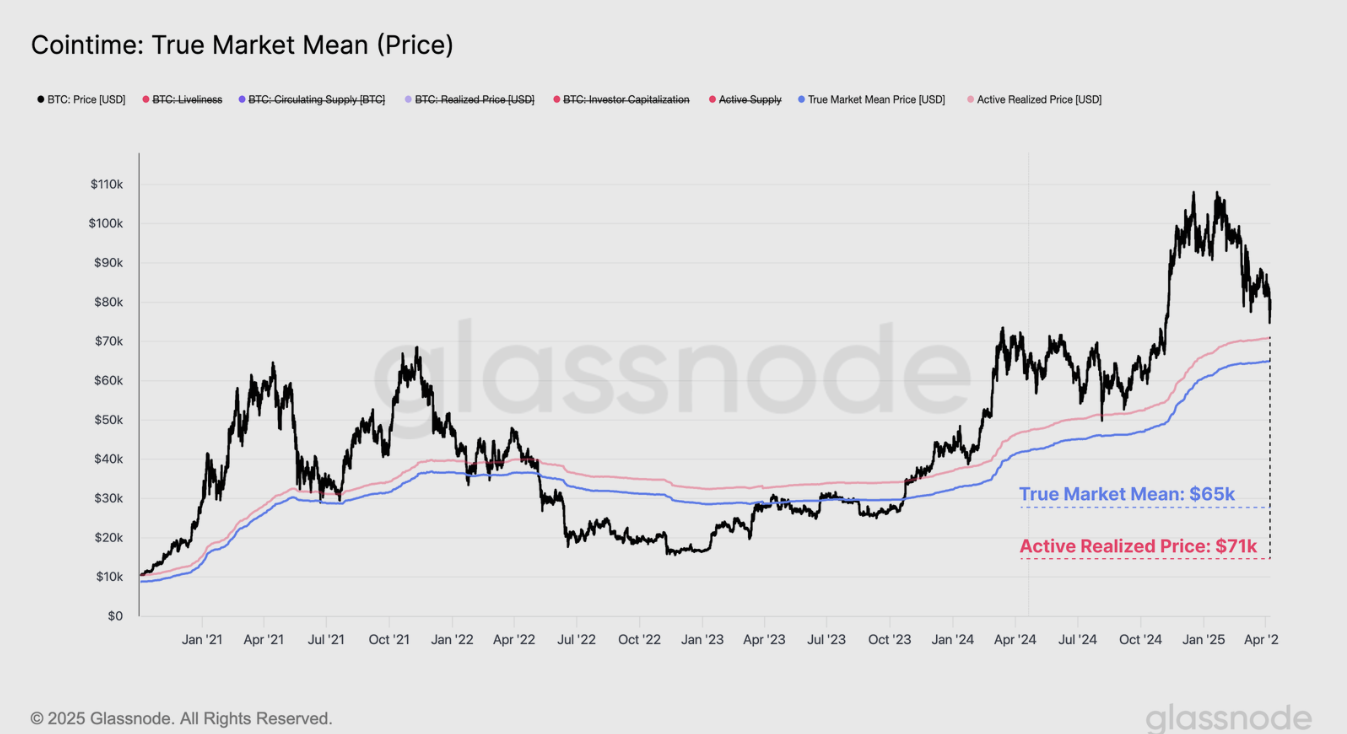
Cointime: True Market Mean (Price) chart. Source: Glassnode
As explained in the previous report, China’s weakening Yuan could lead to increased money printing, which historically boosts Bitcoin’s value as a hedge against currency devaluation.
Bitcoin Price Forecast: Dead-Cat bounce or a trendline breakout
Bitcoin’s price was rejected from its daily resistance of $85,000 on April 2 and declined 10.55% until Tuesday. It also reached a new year-to-date low of $74,508 on Monday. However, BTC recovered 8% and closed above $82,600 on Wednesday. At the time of writing on Thursday, it stabalizes at around $82,000.
Bitcoin’s current price action looks indecisive, and two possibilities can be played out.
In a ‘dead cat bounce’ scenario, a temporary, short-lived recovery towards the $85,000 resistance level could play out before continuing its downward trend.
The daily chart’s Relative Strength Index (RSI) indicator supports a ‘dead cat’ situation after a sharp recovery on Wednesday. Currently, the RSI reads 47, pointing downward after being rejected from its neutral level of 50, indicating a rise in bearish momentum. If the RSI falls sharply, BTC could see a correction ahead.
If BTC continues its downward trend, it could extend the decline to retest its next daily support level at $73,072.
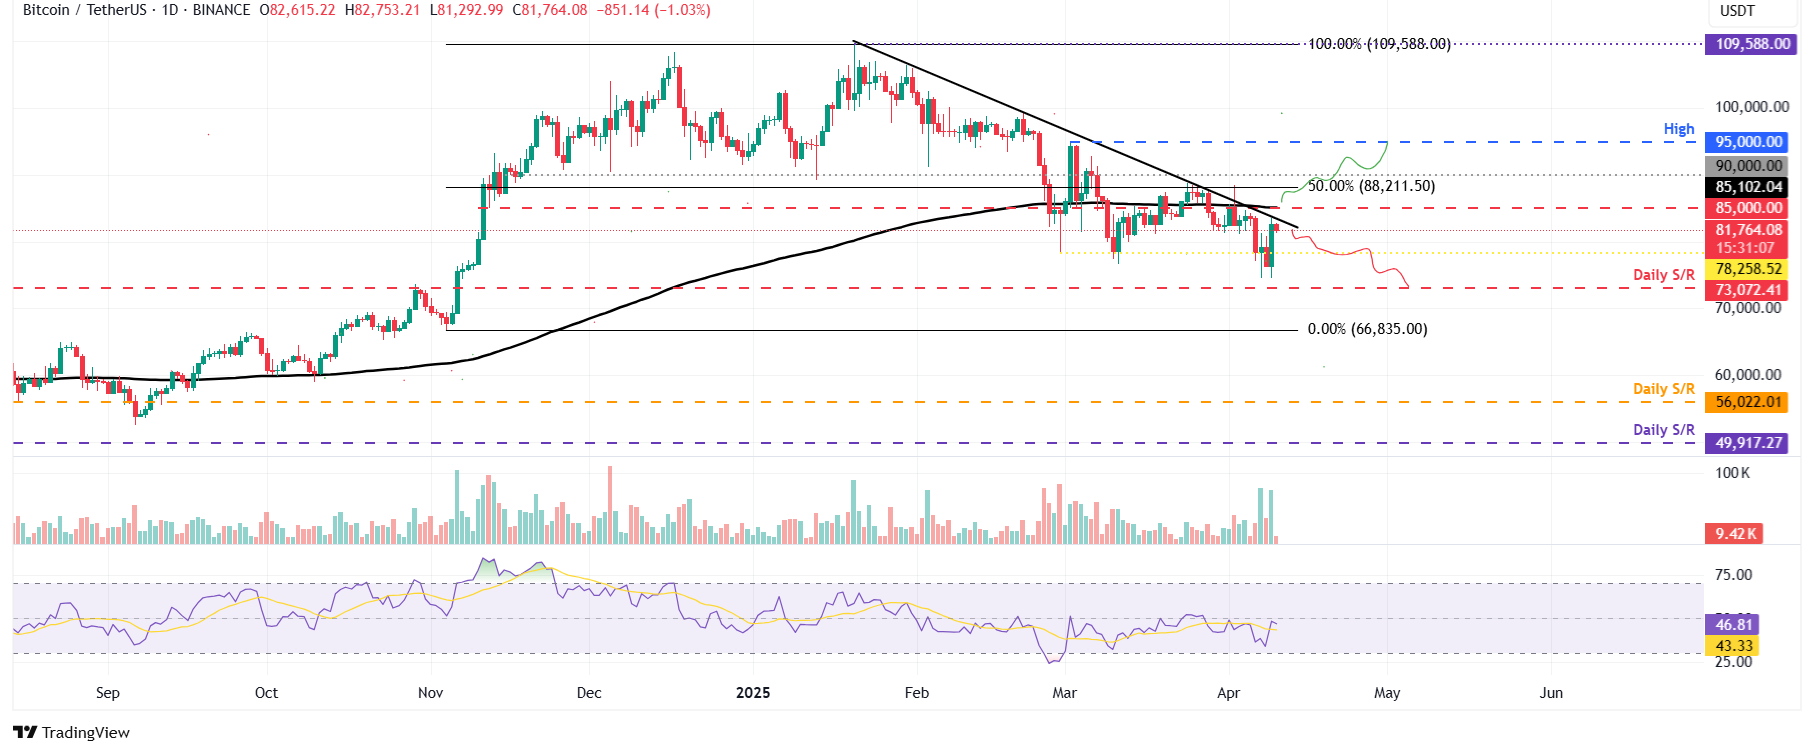
BTC/USDT daily chart
However, another possibility is that BTC continues its recovery following Wednesday’s sharp positive move and breaks and closes above the descending trendline (drawn by connecting multiple high levels since mid-January), which coincides with the daily resistance level and the 200-day Exponential Moving Average (EMA) at $85,000.
In this case, BTC could extend the recovery to retest the key psychological level of $90,000 and the March 2 high of $95,000.
Bitcoin, altcoins, stablecoins FAQs
Bitcoin is the largest cryptocurrency by market capitalization, a virtual currency designed to serve as money. This form of payment cannot be controlled by any one person, group, or entity, which eliminates the need for third-party participation during financial transactions.
Altcoins are any cryptocurrency apart from Bitcoin, but some also regard Ethereum as a non-altcoin because it is from these two cryptocurrencies that forking happens. If this is true, then Litecoin is the first altcoin, forked from the Bitcoin protocol and, therefore, an “improved” version of it.
Stablecoins are cryptocurrencies designed to have a stable price, with their value backed by a reserve of the asset it represents. To achieve this, the value of any one stablecoin is pegged to a commodity or financial instrument, such as the US Dollar (USD), with its supply regulated by an algorithm or demand. The main goal of stablecoins is to provide an on/off-ramp for investors willing to trade and invest in cryptocurrencies. Stablecoins also allow investors to store value since cryptocurrencies, in general, are subject to volatility.
Bitcoin dominance is the ratio of Bitcoin’s market capitalization to the total market capitalization of all cryptocurrencies combined. It provides a clear picture of Bitcoin’s interest among investors. A high BTC dominance typically happens before and during a bull run, in which investors resort to investing in relatively stable and high market capitalization cryptocurrency like Bitcoin. A drop in BTC dominance usually means that investors are moving their capital and/or profits to altcoins in a quest for higher returns, which usually triggers an explosion of altcoin rallies.


