- Silver gains positive traction for the third straight day and climbs to over a one-week high.
- Mixed oscillators on the daily chart warrant some caution for aggressive bullish traders.
- Weakness below the $25.00 mark is more likely to get bought into and remain limited.
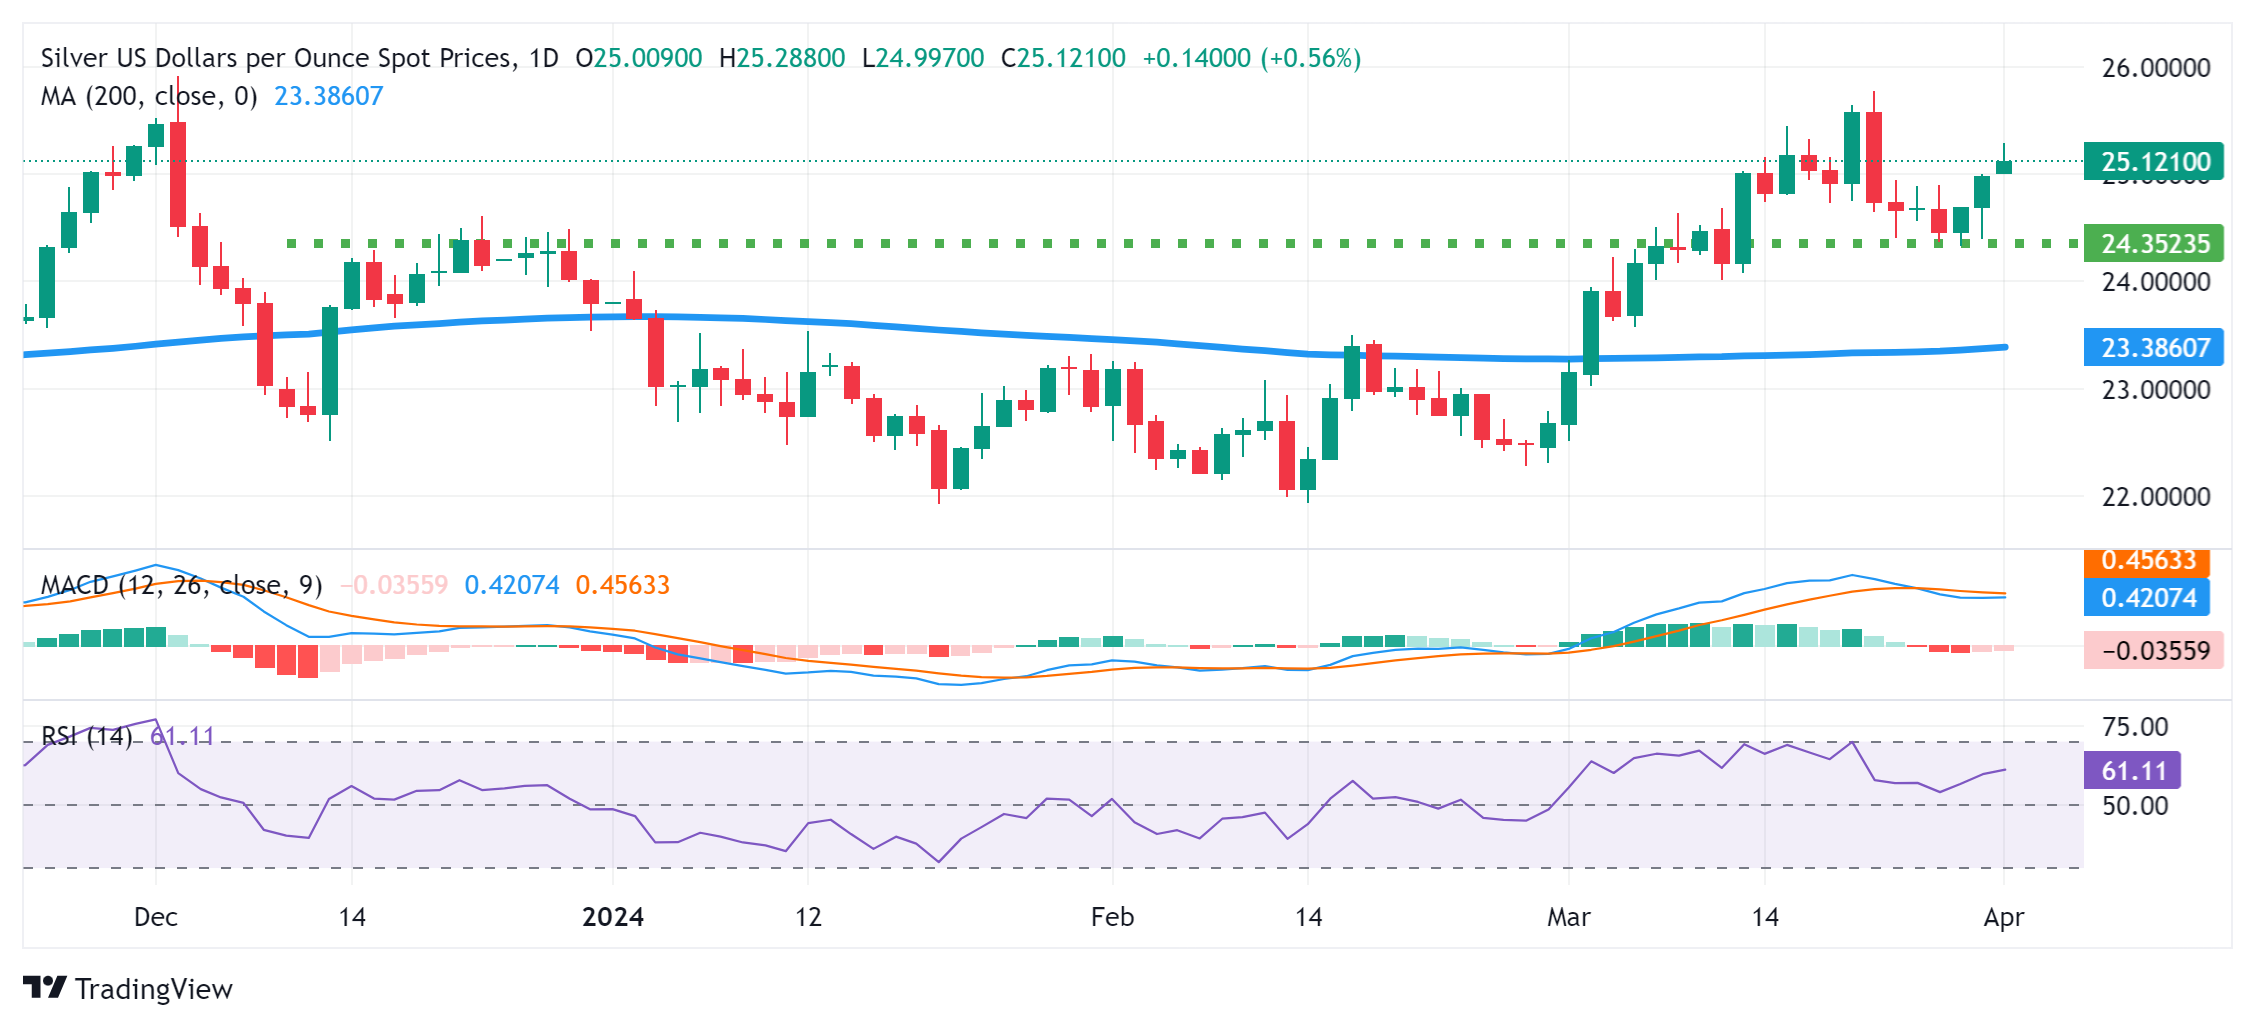
Silver (XAG/USD) builds on last week’s bounce from the $24.35 resistance-turned-support zone and gains positive traction for the third successive day on Monday. The white metal sticks to its intraday gains through the first half of the European session and currently trades around the $25.15 region, just below a more than one-week top touched earlier today.
Meanwhile, mixed technical indicators on the daily chart warrant some caution for bullish traders. Hence, any subsequent move up is more likely to confront stiff resistance near the $25.65-$25.75 region, or the YTD peak touched in March. This is closely followed by the December 2023 swing high – levels just ahead of the $26.00 round figure. A sustained strength beyond the said handle should allow the XAG/USD to resume its recent strong uptrend witnessed since late February.
On the flip side, weakness back below the $25.00 psychological mark is likely to attract fresh buyers near the $24.65 region. This should help limit the downside for the XAG/USD near the aforementioned resistance-turned-support, around the $24.35 zone. The latter should act as a key pivotal point, which if broken decisively might shift the bias in favour of bearish traders and drag the white metal to the next relevant support near the $24.15-$24.10 region en route to the $24.00 mark.
Some follow-through selling would make the XAG/SUD vulnerable to accelerate the downward trajectory further towards the 200-day Simple Moving Average (SMA), currently pegged around the $23.35-$23.30 region.
Silver daily chart


