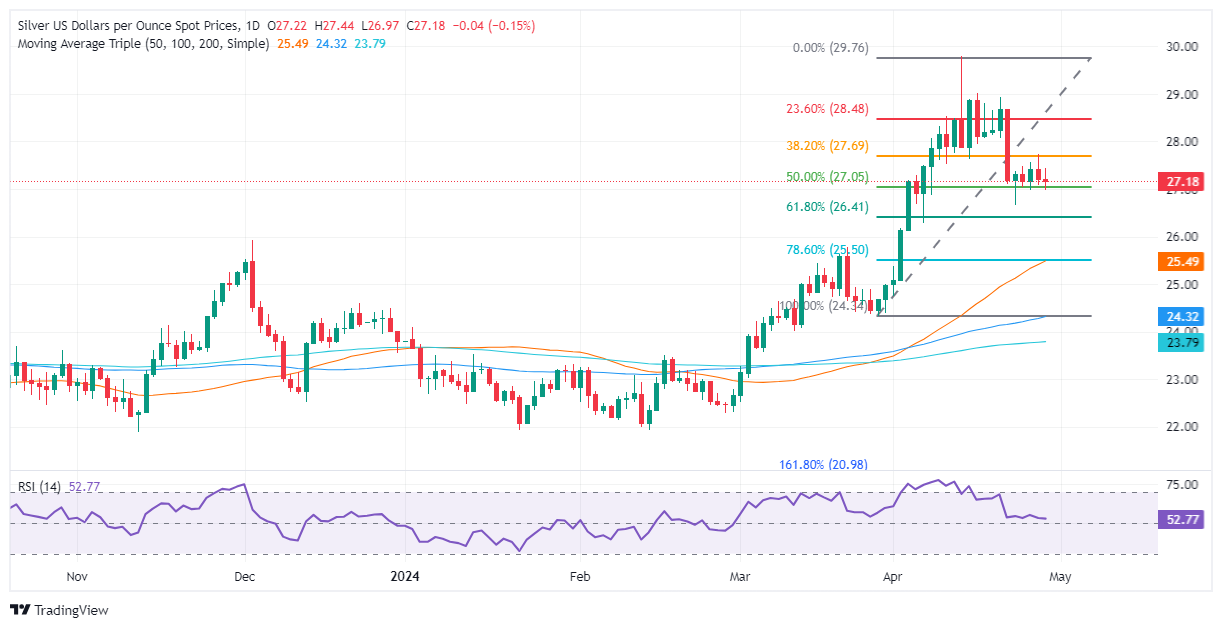
- Silver retreats from a high of $27.43 while interacting with key Fibonacci retracement levels.
- XAG/USD consolidates within the $27.05 to $27.70 Fibonacci range.
- A break above $27.70 could open the path to higher resistances at $28.00 and possibly extend towards the $29.00 mark and the annual high at $29.76.
- Should it fall below $27.05, Silver might target further supports at $26.41 and the crucial $25.50 level.
Silver’s price edged down late during Monday’s North American session. It lost some 0.10% after reaching a daily high of $27.43 hit during the North American session. At the time of writing, XAG/USD trades at $27.12.
XAG/USD Price Analysis: Technical outlook
The XAG/USD daily chart suggests the grey metal is consolidating between 50% and 38.2% Fibonacci retracement, within the $27.05-$27.70 area of the Fib drawn from the swing low at $24.34 to the latest high at $29.76.
For a bullish continuation, traders need to reclaim the top of the abovementioned range at $27.70 so they can threaten to breach the $28.00 milestone. Once cleared, the next resistance would be the 23.6% Fib retracement at $28.48, followed by the $29.00 mark. The next supply area would be the year-to-date (YTD) high at $29.76.
On the flip side, bears could find some relief if XAG/USD slides below the 50% Fib retracement at $27.05, followed by the 61.8% retracement at $26.41. A subsequent dip is seen below that level, exposing the confluence of the 50-day moving average (DMA) and the 78.6% Fib retracement at $25.50.
XAG/USD Price Action – Daily Chart