
- XRP price sits on top of the 50-day EMA support as bulls struggle to steady the trend toward $3.00.
- A 44% drop in active addresses since January 1 indicates lack of confidence in XRP’s ability to sustain the uptrend.
- The rise in long liquidations of XRP futures, along with the increase in volume, suggests bearish sentiment.
Ripple’s (XRP) price has been moving broadly sideways for over a week while trading at $2.33 at the time of writing on Tuesday. The cross-border money remittance token climbed to $2.65 on May 12, buoyed by strong sentiment around Bitcoin’s (BTC) surge to new all-time highs. However, the uptrend snapped, leaving XRP vulnerable to losses amid potential profit-taking and a lack of conviction in the uptrend toward $3.00. The choppy action in a narrow range between $2.27 and $2.34 suggests that traders could stay cautious until the stalemate between the bulls and bears is resolved.
XRP Ledger’s active addresses drop 44% as confidence falters
The extended consolidation in XRP price points to changes in key fundamentals, including user interaction with the blockchain protocol. CryptoQuant’s Active Addresses metric, as shown in the chart below, indicates a significant 44% decline from 39,515 to 22,253 addresses.
Based on the chart, this metric has a positive correlation with XRP price. A persistent decline in the number of active addresses often has a negative impact on the token, potentially leading to price drops.
The Active Addresses on-chain metric tracks the number of addresses or users transacting on the XRP Ledger, whether by sending or receiving XRP.
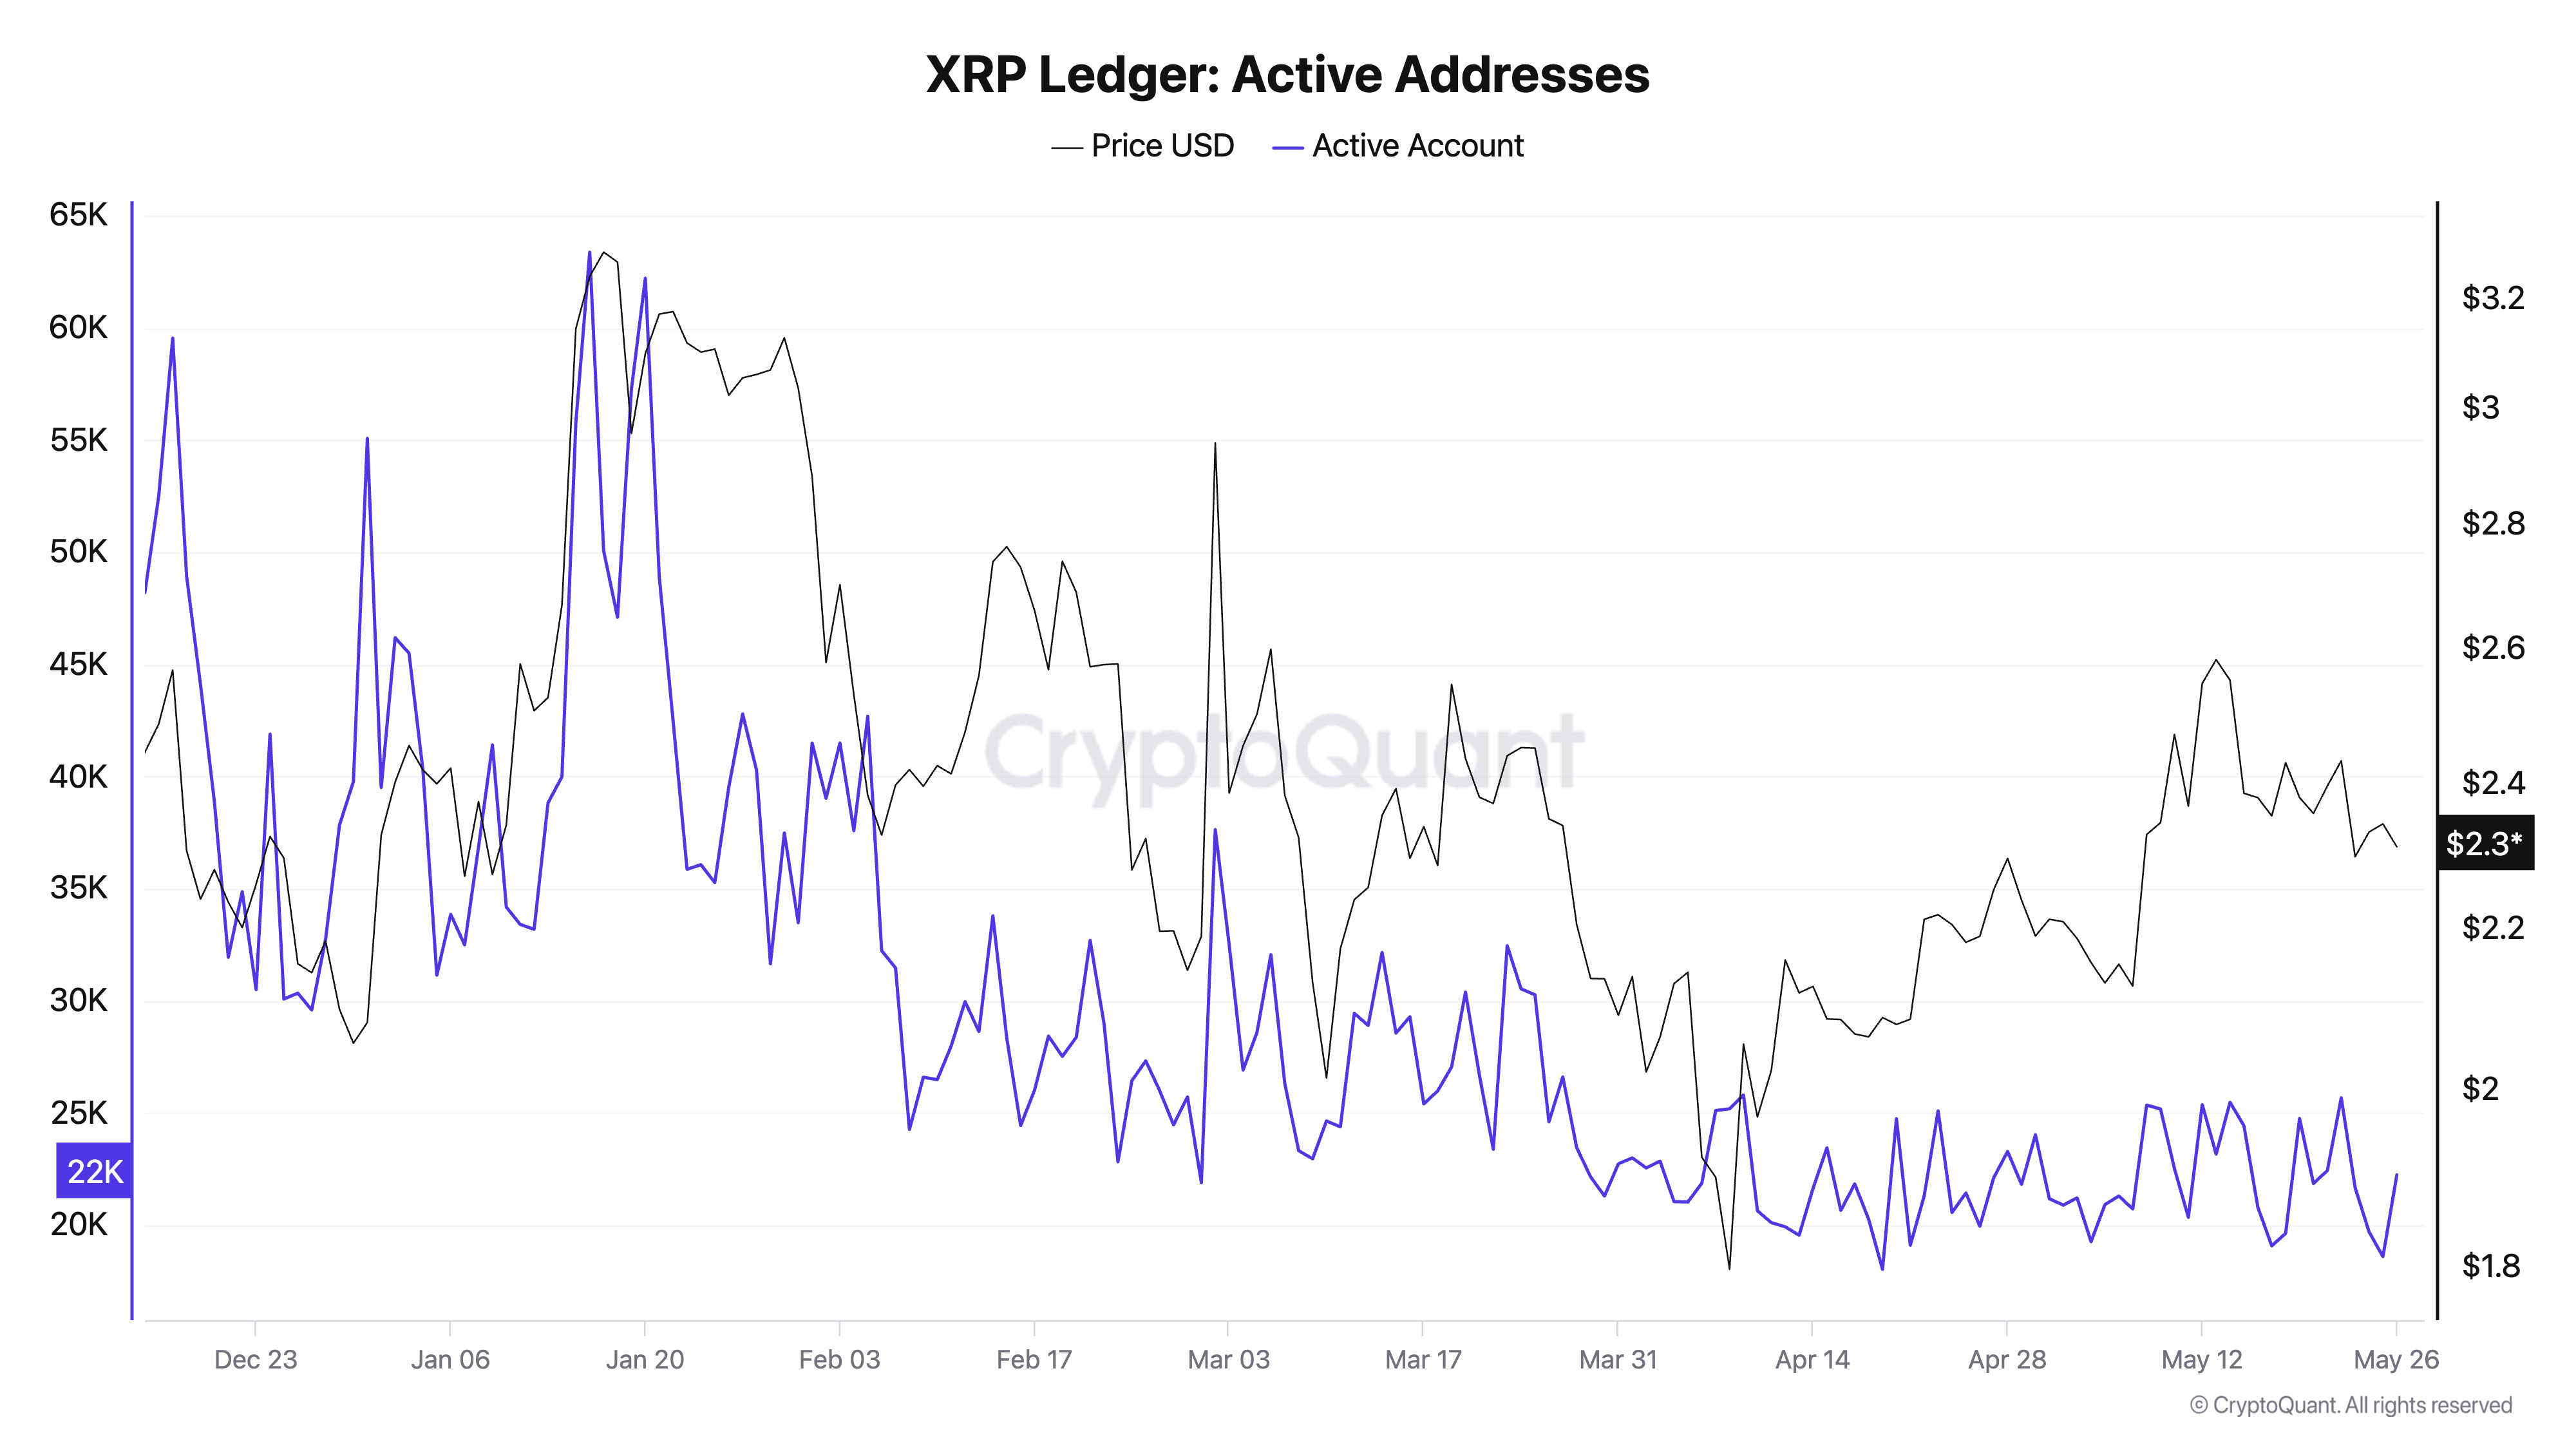
XRP Active Addresses | Source: CryptoQuant
Meanwhile, CoinGlass data shows that the lack of conviction extends to the microenvironment, with the XRP futures Open Interest (OI) falling from a recent peak of $5.52 billion on May 14 to $4.77 billion at the time of writing.
OI refers to the total number of active futures contracts that have yet to be settled or closed. The decrease in OI suggests that traders are closing positions amid changing market dynamics, culminating in low activity while increasing the probability of an extended downtrend.
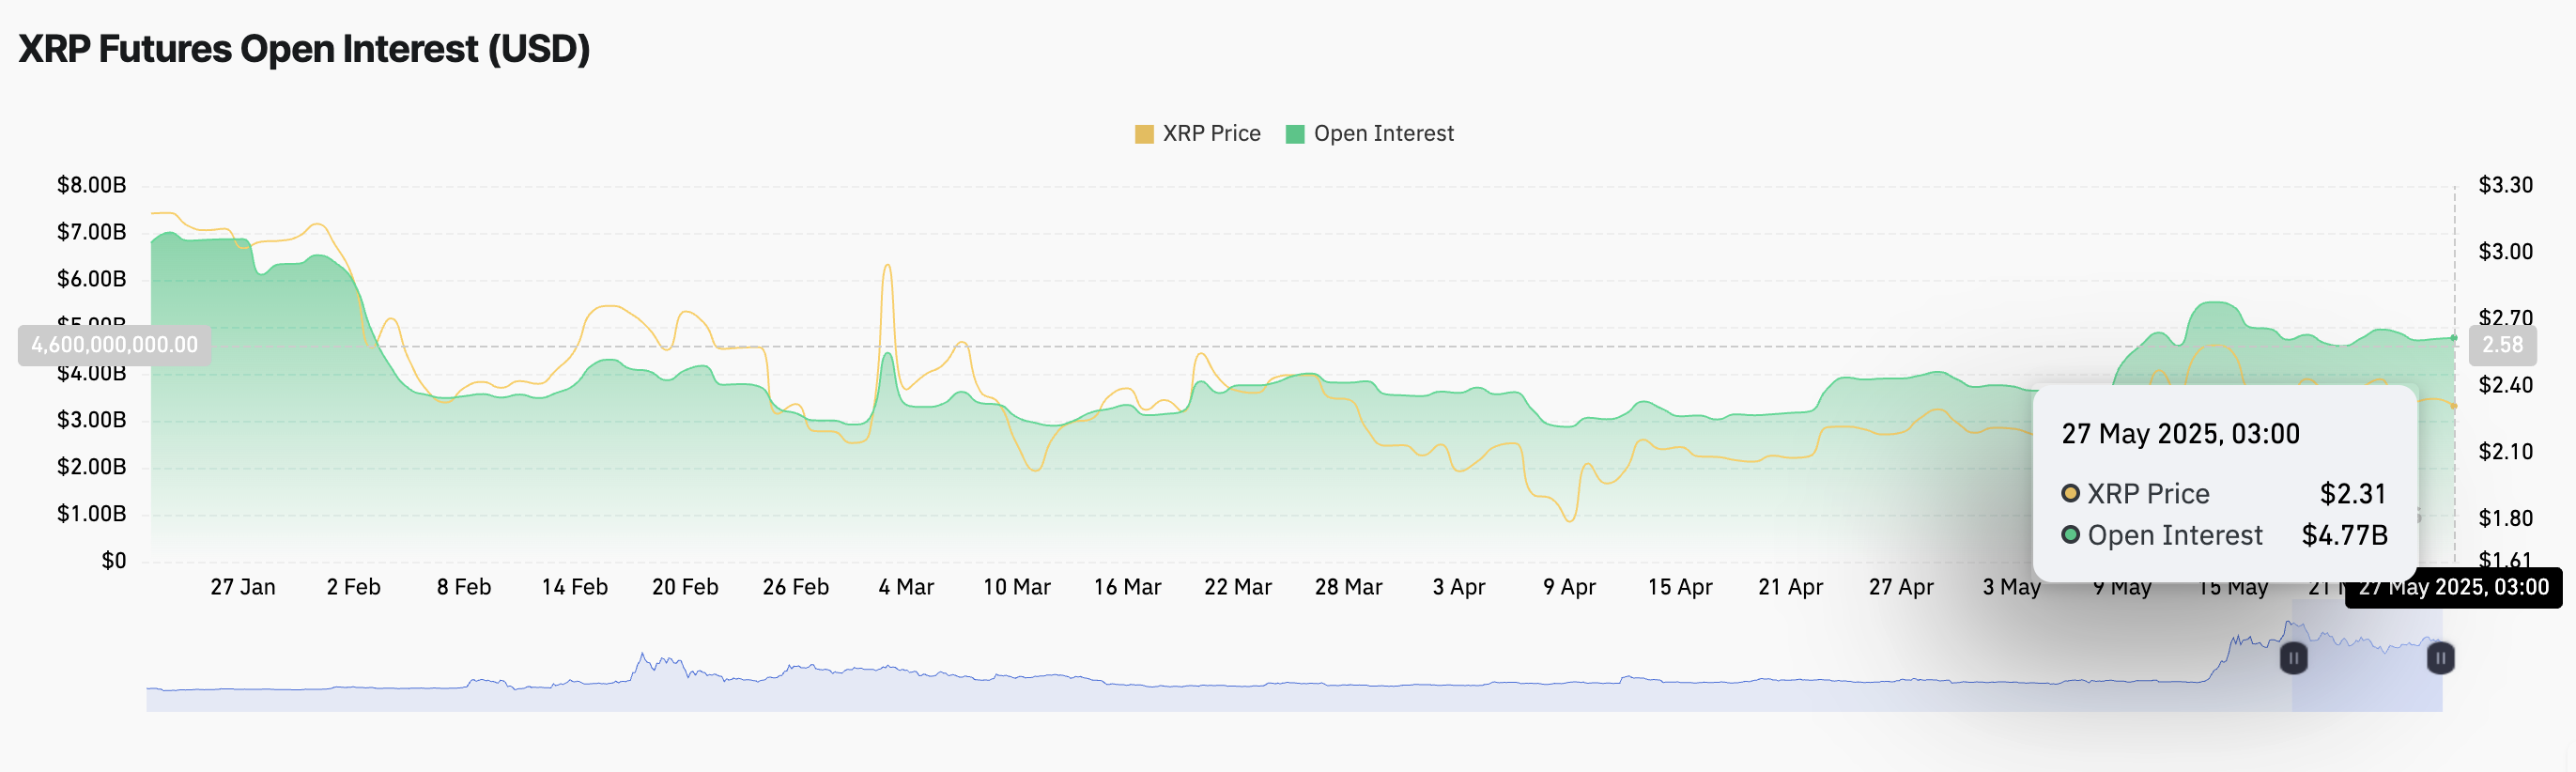
XRP futures OI | Source: CoinGlass
A subsequent increase in trading volume, as long position liquidations rise to $3.19 million compared to nearly $500,000 in shorts, points to bearish sentiment taking center stage.
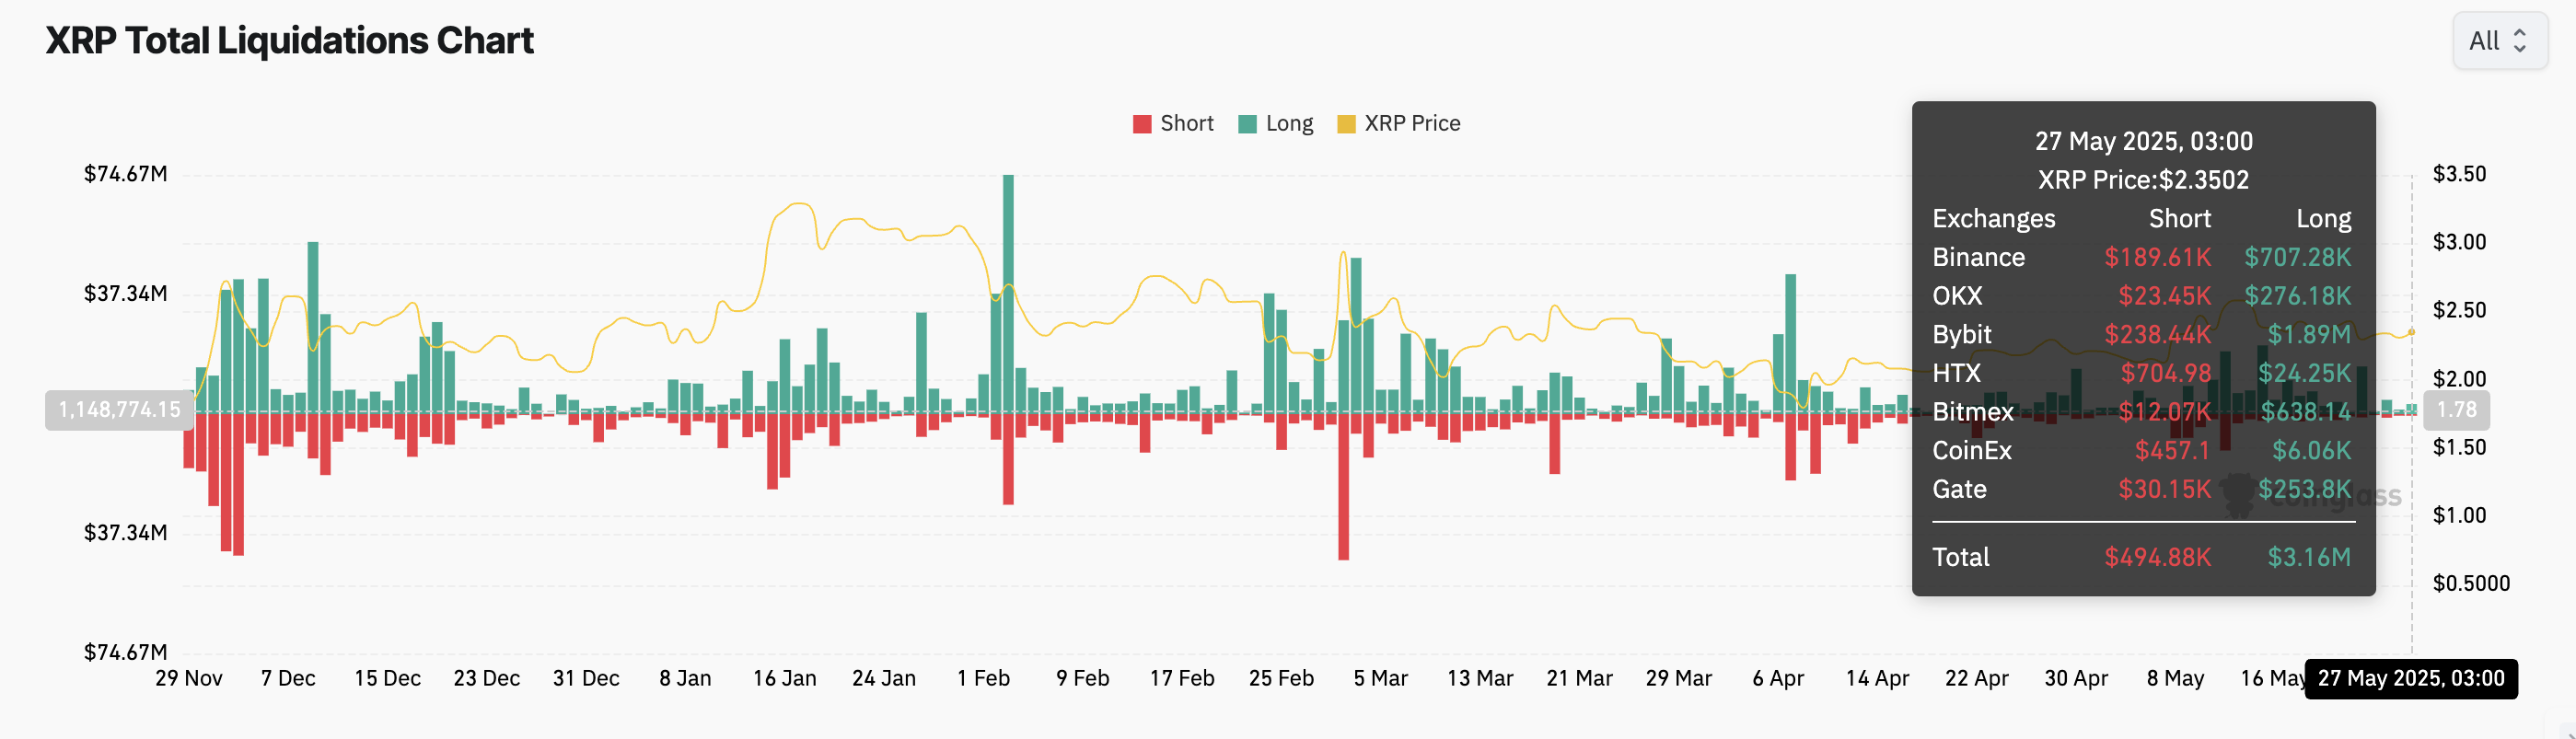
XRP futures liquidations | Source: CoinGlass
While XRP price trades broadly sideways in a narrow range between $2.27 and $2.34, traders should temper expectations until the next breakout is confirmed.
Technical outlook: Can XRP bulls steady the uptrend?
XRP price hovers slightly above the short-term support provided by the 50-day Exponential Moving Average (EMA) at approximately $2.30. Slightly below this level, the 100-day EMA is reinforcing the support at $2.27.
Despite the strong support, a sell signal confirmed by the Moving Average Convergence Divergence (MACD) indicator on May 20 could encourage traders to sell XRP. This signal occurs when the blue MACD line crosses above the red signal line.
At the same time, the Money Flow Index (MFI), a momentum indicator that measures the flow of money into and out of XRP, is downward. The drop from near-overbought conditions at 76 on May 14 supports the bearish outlook.
A price movement below the 50-day EMA and the 100-day EMA could indicate increasing selling pressure. Hence, key areas of interest for traders likely to buy the dip include the 200-day EMA at $2.06 and the April 7 low at $1.61.
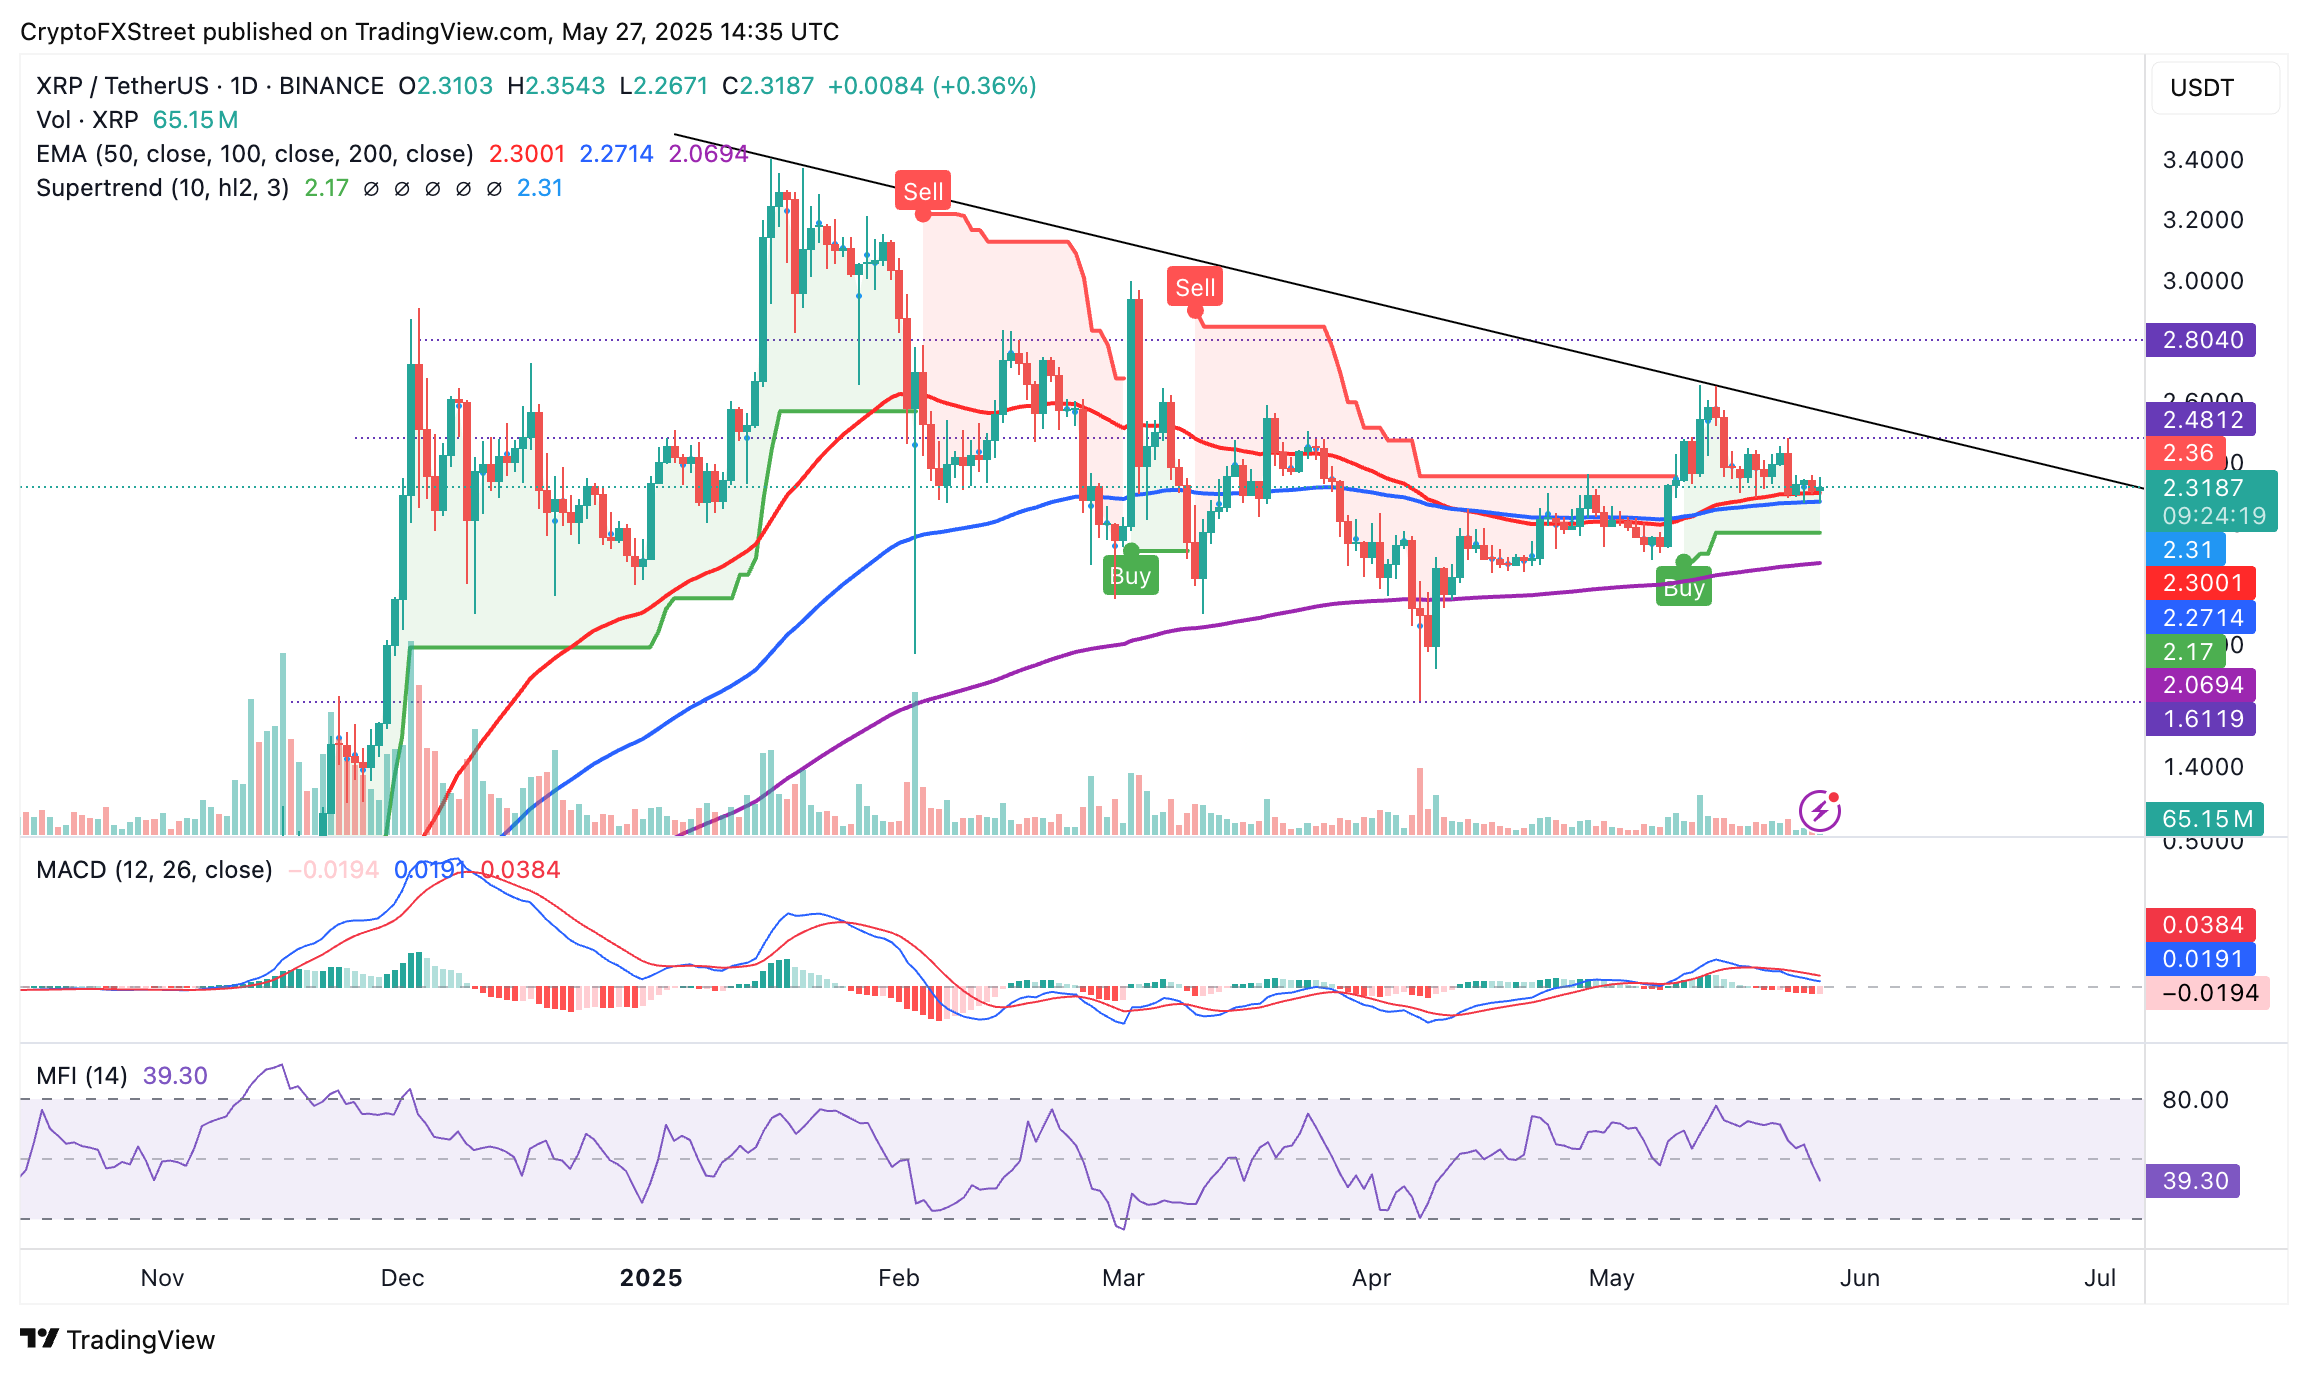
XRP/USDT daily chart
Still, the SuperTrend indicator displays a buy signal, indicating that bulls still have the upper hand and could resolve the current indecision to the upside. The SuperTrend is a trend-following volatility indicator that sends a buy signal when the price crosses above it, changing color from red to green. As long as it trails the XRP price, the probability of a bullish breakout would remain high.
Key levels and milestones for monitoring progress toward the $3.00 target include a break above the descending trendline and the supply zone at $2.80, which was tested as resistance in February and December.