- Ripple partners with SBI Digital Commodity, a Japanese financial giant, to boost XRPLedger utility.
- XRP suffers from rising selling pressure as traders took over $230 million in profits in August.
- XRP extends losses on Thursday, slipping under key support at $0.57.
Ripple (XRP) price falls for a second consecutive session, struggling under a key support level, as increased selling pressure from profit-taking outweighs positive developments for the business of the payment-remittance firm.
XRP trades under $0.57 at the time of writing.
Daily Digest Market Movers: XRP falls despite Ripple announcing partnership
- Ripple announced a partnership with Japanese financial giant SBI Digital Commodity on Tuesday. The firm will promote the use of the XRP Ledger in the web3 community through the partnership with Ripple Labs, per their official announcement.
- On-chain data from Santiment shows that XRP traders have consistently taken profits on their XRP holdings. Specifically, XRP traders have taken more than $230 million in gains in August so far, relatively higher than July.
- The Network Realized Profit/Loss metric (NPL) has shown positive spikes since the beginning of August, in a sign that XRP traders are on average selling their holdings at a profit. Consistent profit-taking increases the selling pressure on the asset.
- The level of profit-taking is higher than July, when many traders opted to sell during the sharp correction. The activities have led XRP to slip under the $0.57 support on Thursday, which is a key technical level.
%20%5B14.25.20,%2015%20Aug,%202024%5D-638593159754601958.png)
XRP NPL vs. price
- XRP social dominance has also dropped somewhat over the last week, falling to to 1.65% from 4.55%.
Technical analysis: XRP slips under key support at $0.57
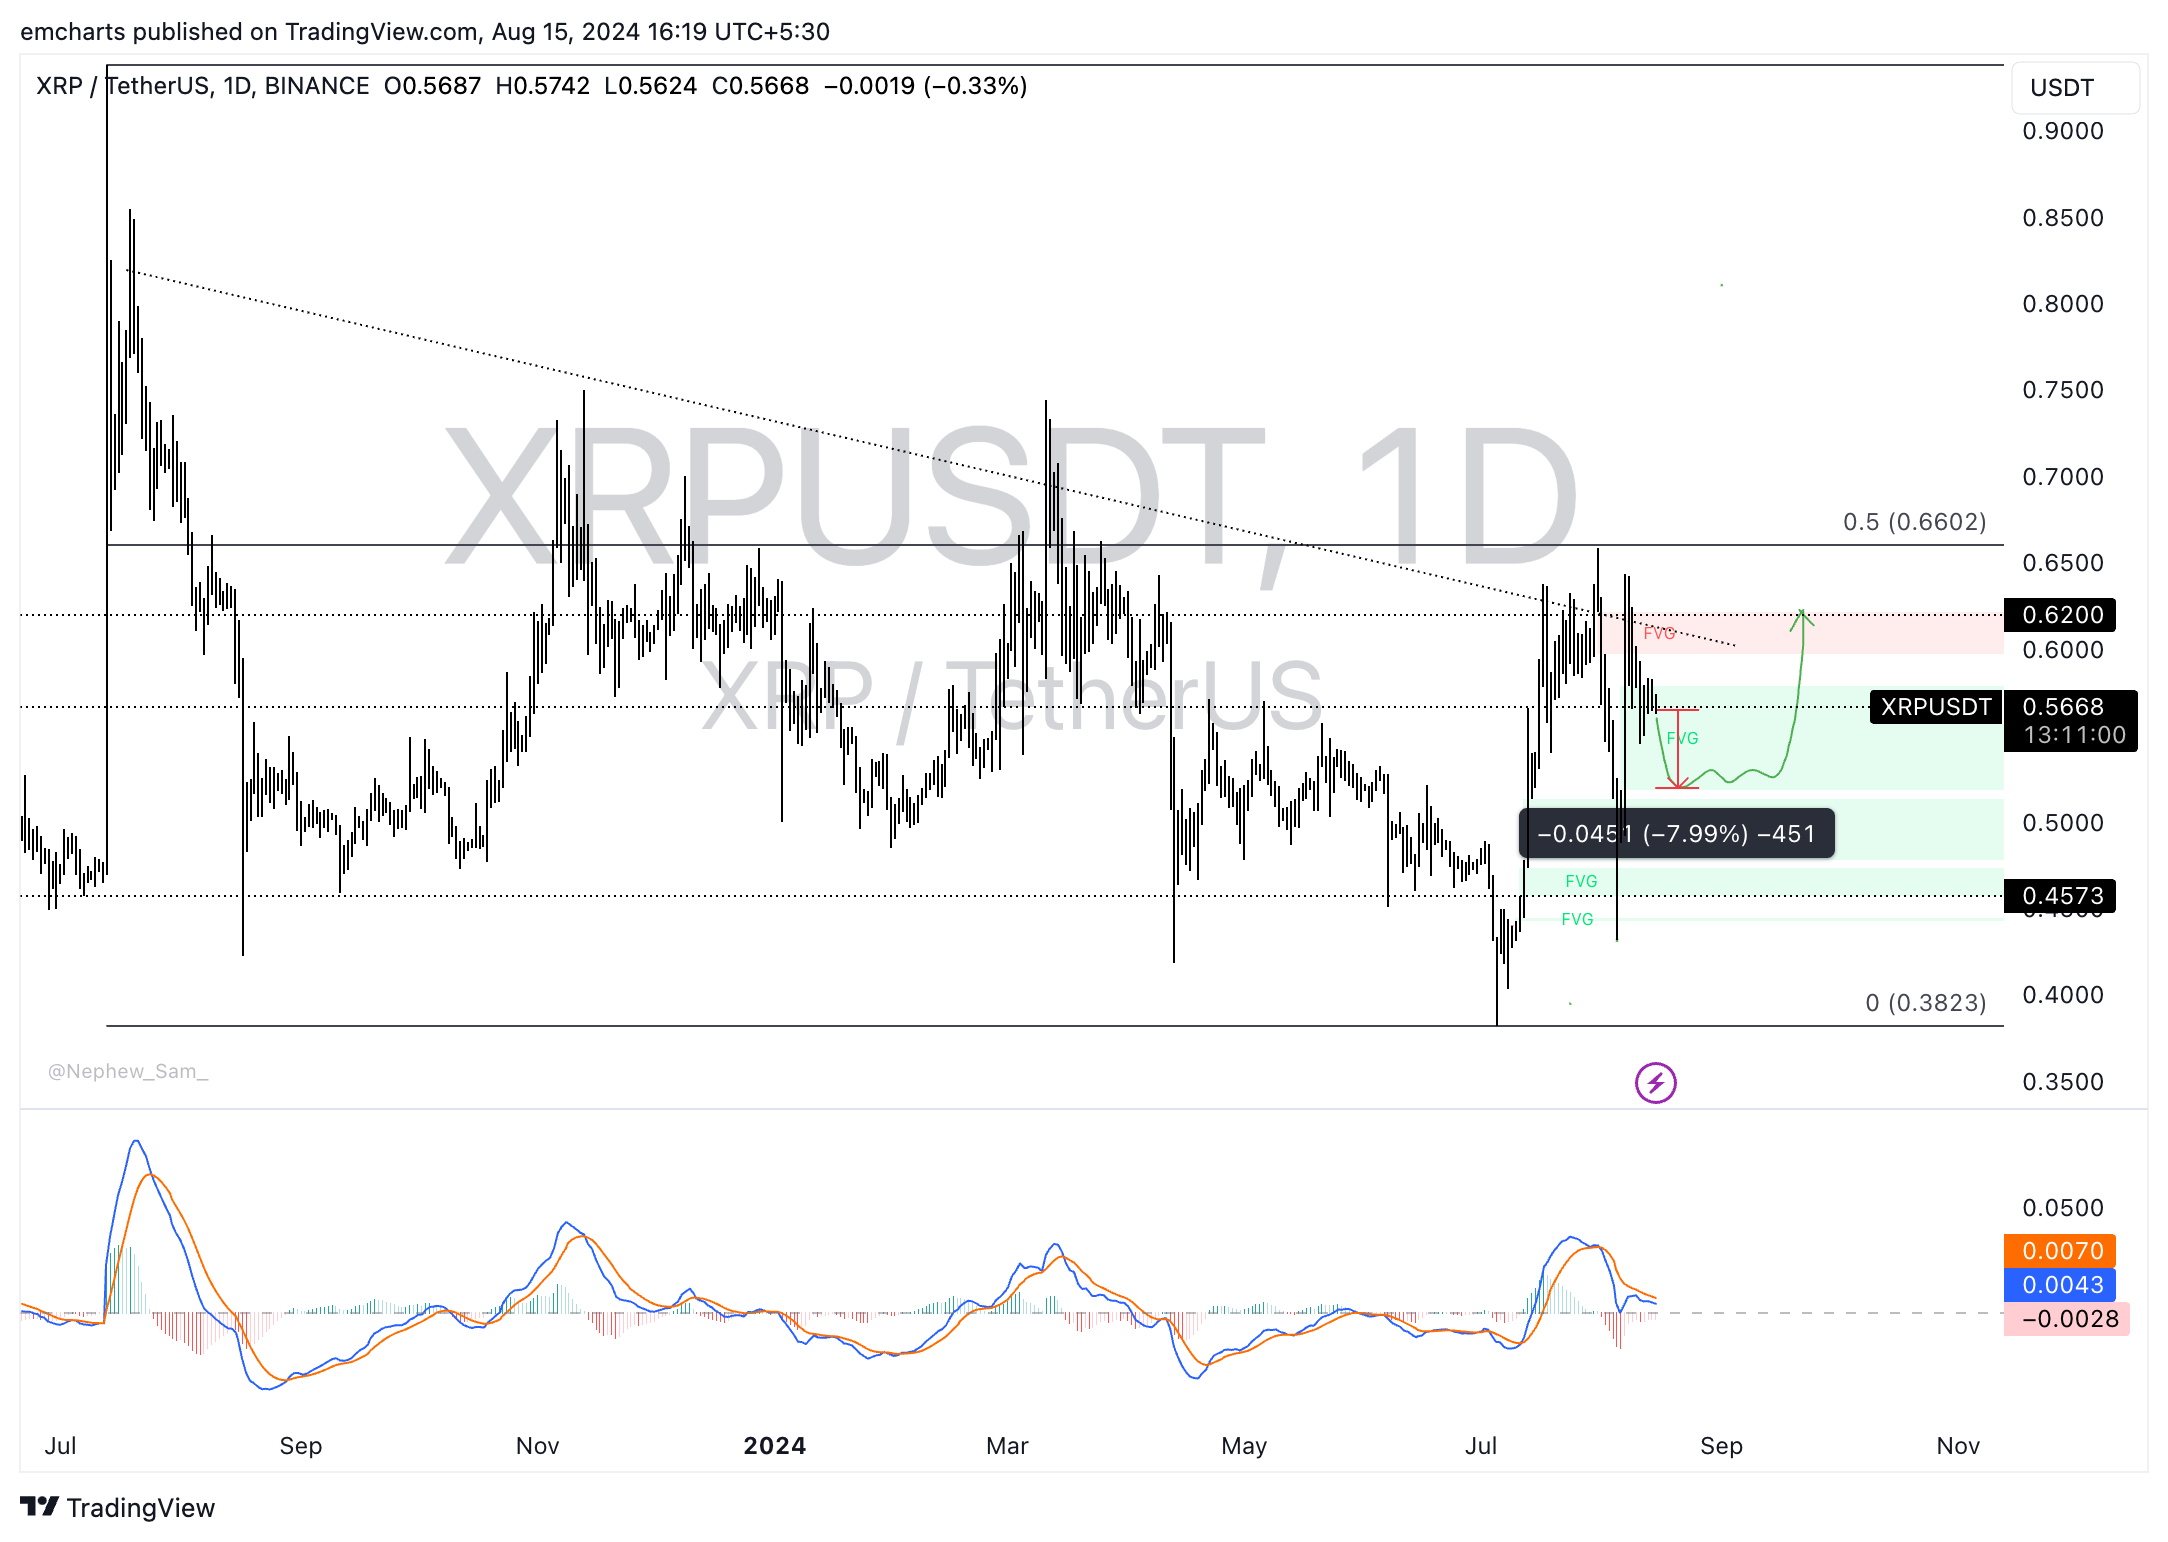
XRP is in downward trend which has extended for more than a year. In the short-term, the altcoin has recovered somewhat after touching a year-to-date low at $0.38 on July 5. Still, any significant recovery from the current price at around $0.56 seems unlikely without a clear catalyst on sight.
The Moving Average Convergence Divergence (MACD) indicator shows there is underlying negative momentum in Ripple price trend.
If this negative bias is confirmed, the altcoin could suffer a nearly 8% decline and dip to the lower boundary of the Fair Value Gap (FVG) at $0.51. Once the imbalance zone is filled, there is a likelihood of a comeback to the target at $0.62, a key resistance level for the asset since mid-March.

XRP/USDT daily chart
A daily candlestick close above $0.60 could invalidate the bearish thesis. In this case, XRP could rally to $0.62.
Cryptocurrency metrics FAQs
The developer or creator of each cryptocurrency decides on the total number of tokens that can be minted or issued. Only a certain number of these assets can be minted by mining, staking or other mechanisms. This is defined by the algorithm of the underlying blockchain technology. Since its inception, a total of 19,445,656 BTCs have been mined, which is the circulating supply of Bitcoin. On the other hand, circulating supply can also be decreased via actions such as burning tokens, or mistakenly sending assets to addresses of other incompatible blockchains.
Market capitalization is the result of multiplying the circulating supply of a certain asset by the asset’s current market value. For Bitcoin, the market capitalization at the beginning of August 2023 is above $570 billion, which is the result of the more than 19 million BTC in circulation multiplied by the Bitcoin price around $29,600.
Trading volume refers to the total number of tokens for a specific asset that has been transacted or exchanged between buyers and sellers within set trading hours, for example, 24 hours. It is used to gauge market sentiment, this metric combines all volumes on centralized exchanges and decentralized exchanges. Increasing trading volume often denotes the demand for a certain asset as more people are buying and selling the cryptocurrency.
Funding rates are a concept designed to encourage traders to take positions and ensure perpetual contract prices match spot markets. It defines a mechanism by exchanges to ensure that future prices and index prices periodic payments regularly converge. When the funding rate is positive, the price of the perpetual contract is higher than the mark price. This means traders who are bullish and have opened long positions pay traders who are in short positions. On the other hand, a negative funding rate means perpetual prices are below the mark price, and hence traders with short positions pay traders who have opened long positions.


