
- XRP extends losses below $2.20 as tariff uncertainty rattles investors.
- US core PCE Price Index for April meets expectations at 2.5%, down from 2.7% in March.
- XRP’s pullback shakes off weak hands, with liquidations reaching $30 million over the past 24 hours.
- A sharp 11% decline in derivatives Open Interest, alongside a 40% increase in volume, signals rising volatility ahead of the weekend.
The Ripple (XRP) price faces downside risks as it trades at $2.17 at the time of writing on Friday. The instability witnessed across the cryptocurrency market was ignited by reports that a court had stayed an earlier ruling that blocked the implementation of United States (US) President Donald Trump’s tariffs. If downside risks are left unchecked, bears could explore XRP’s vulnerabilities targeting extended losses below the next key area of interest at $2.00.
Meanwhile, the Bureau of Economic Analysis (BEA) has released the US Personal Consumption Expenditures (PCE) Price Index for April, indicating a cooling of inflation compared to the previous release for March.
Market overview: US Core PCE price index 4-year low
The Core PCE Price Index (excluding food and energy) declined in April to an annual rate of 2.5%, marking the lowest level since March 2021 and meeting market expectations. This marks a softer inflation outlook compared to the previous reading of 2.7% for March this year. The overall PCE annual rate was 2.1%, below the expected 2.2%. On a MoM basis, both core and overall PCE rose by 0.1%.
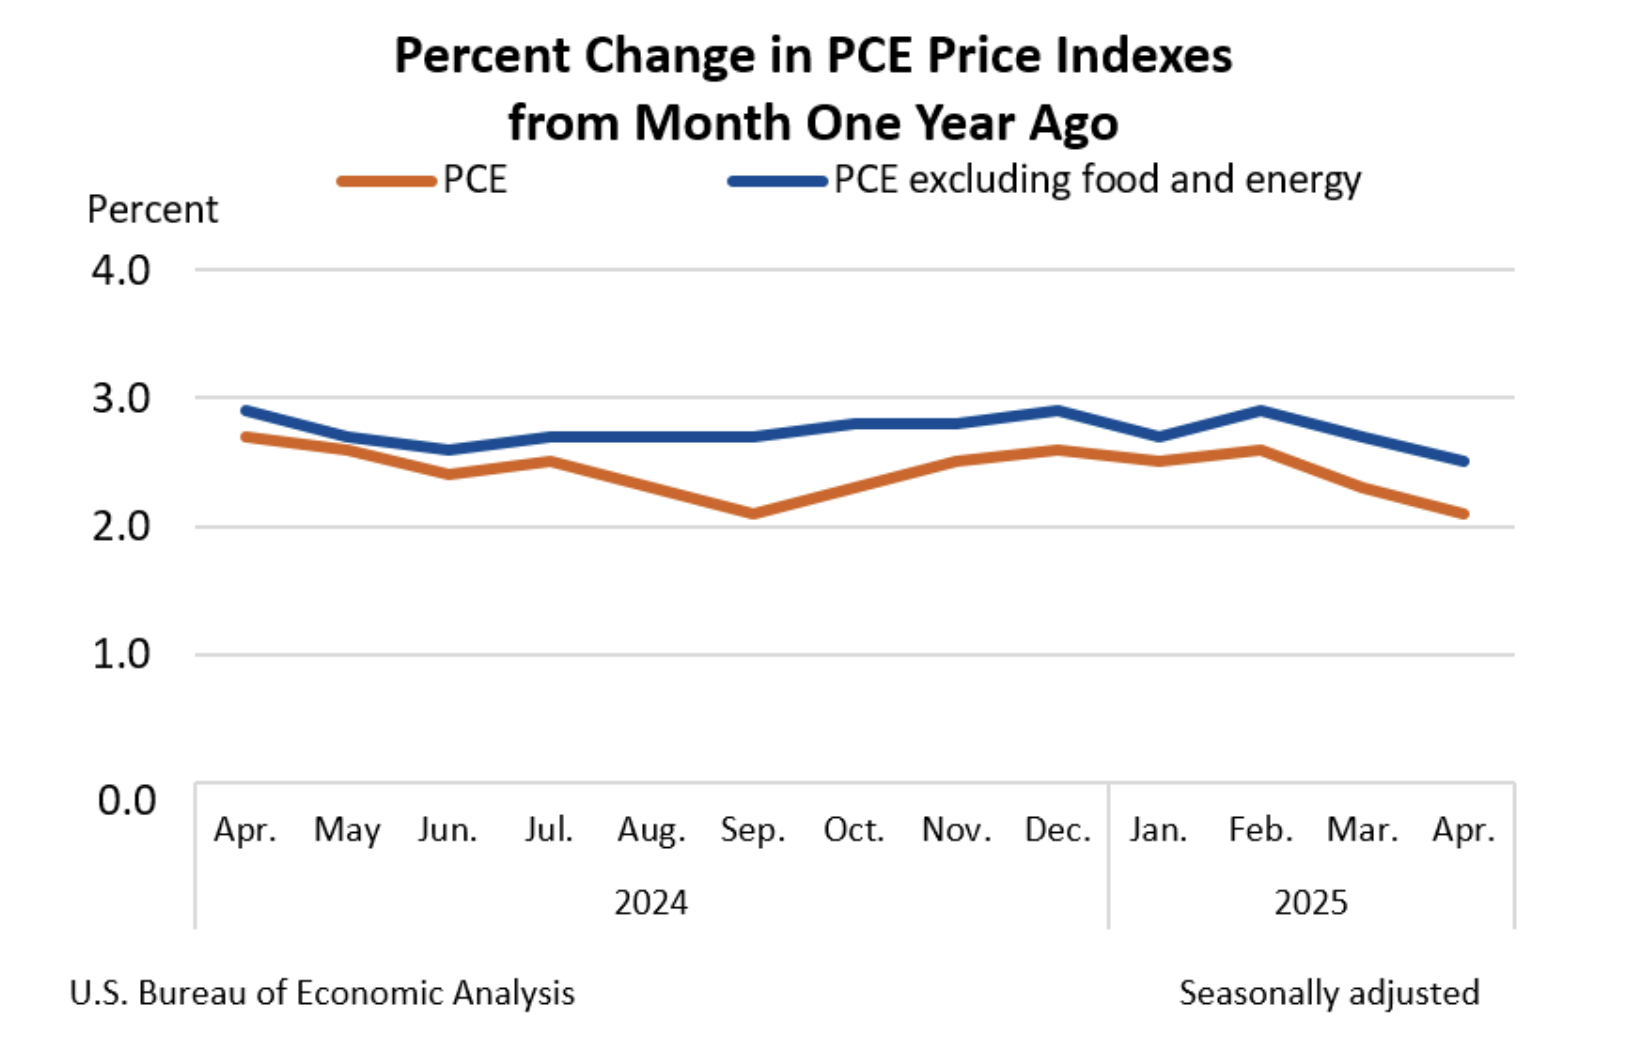
US PCE price index | Source: Bureau of Economic Analysis
However, Federal Reserve (Fed) Chairman Jerome Powell recently cautioned that tariffs could have far-reaching implications for inflation in the long term, suggesting a hawkish stance.
Moreover, the softer inflation is unlikely to significantly boost confidence in global markets, including crypto, especially since a federal appeals court stayed an earlier ruling that blocked the implementation of President Trump’s tariffs. The ruling, issued on Wednesday, stated that the President had overstepped his authority and that Congress reserves the constitutional right to set rules governing trade with other countries.
XRP losses extend as liquidations surge
The sharp pullback has seen XRP extend losses from its recent high of $2.65. Traders with leveraged positions suffered the biggest brunt of the sell-off to $2.17 as liquidation wiped out a combined $30 million in longs and shorts.
Long traders accounted for the lion’s share of the liquidations, losing approximately $29.75 million compared to around $384,000 in shorts.
The subsequent increase in the derivatives Open Interest (OI) by over 10% to $4.2 billion in the past 24 hours, while trading volume soared 42% to $6.3 million, points to swelling volatility.
This situation, where OI is falling while volume and liquidations increase, highlights trader uncertainty, which often results in deleveraging amid bearish market sentiment.
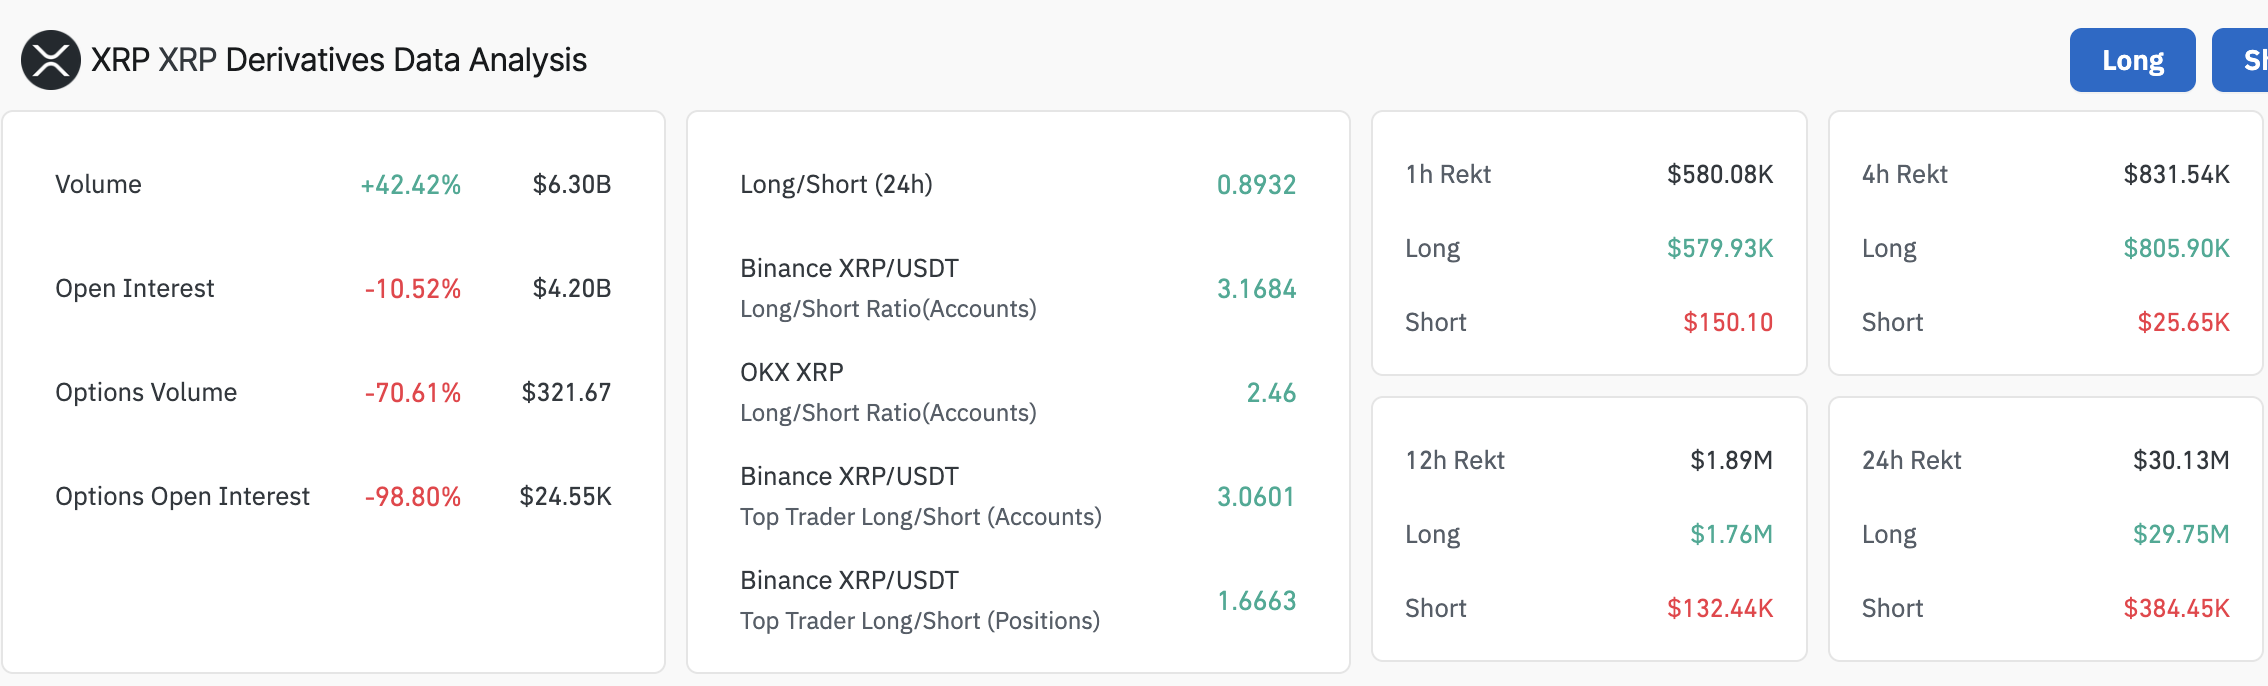
XRP derivatives data | Source: CoinGlass
Technically, XRP’s downside is still heavy, underpinned by a sell signal from the Moving Average Convergence Divergence (MACD) indicator and as it slides beneath the zero line (0.00). Traders often consider selling when the blue MACD line crosses below the red signal line, highlighting bearish momentum.
The same bearish outlook has been reinforced by the downward trend in the Relative Strength Index (RSI), which is approaching the oversold region.
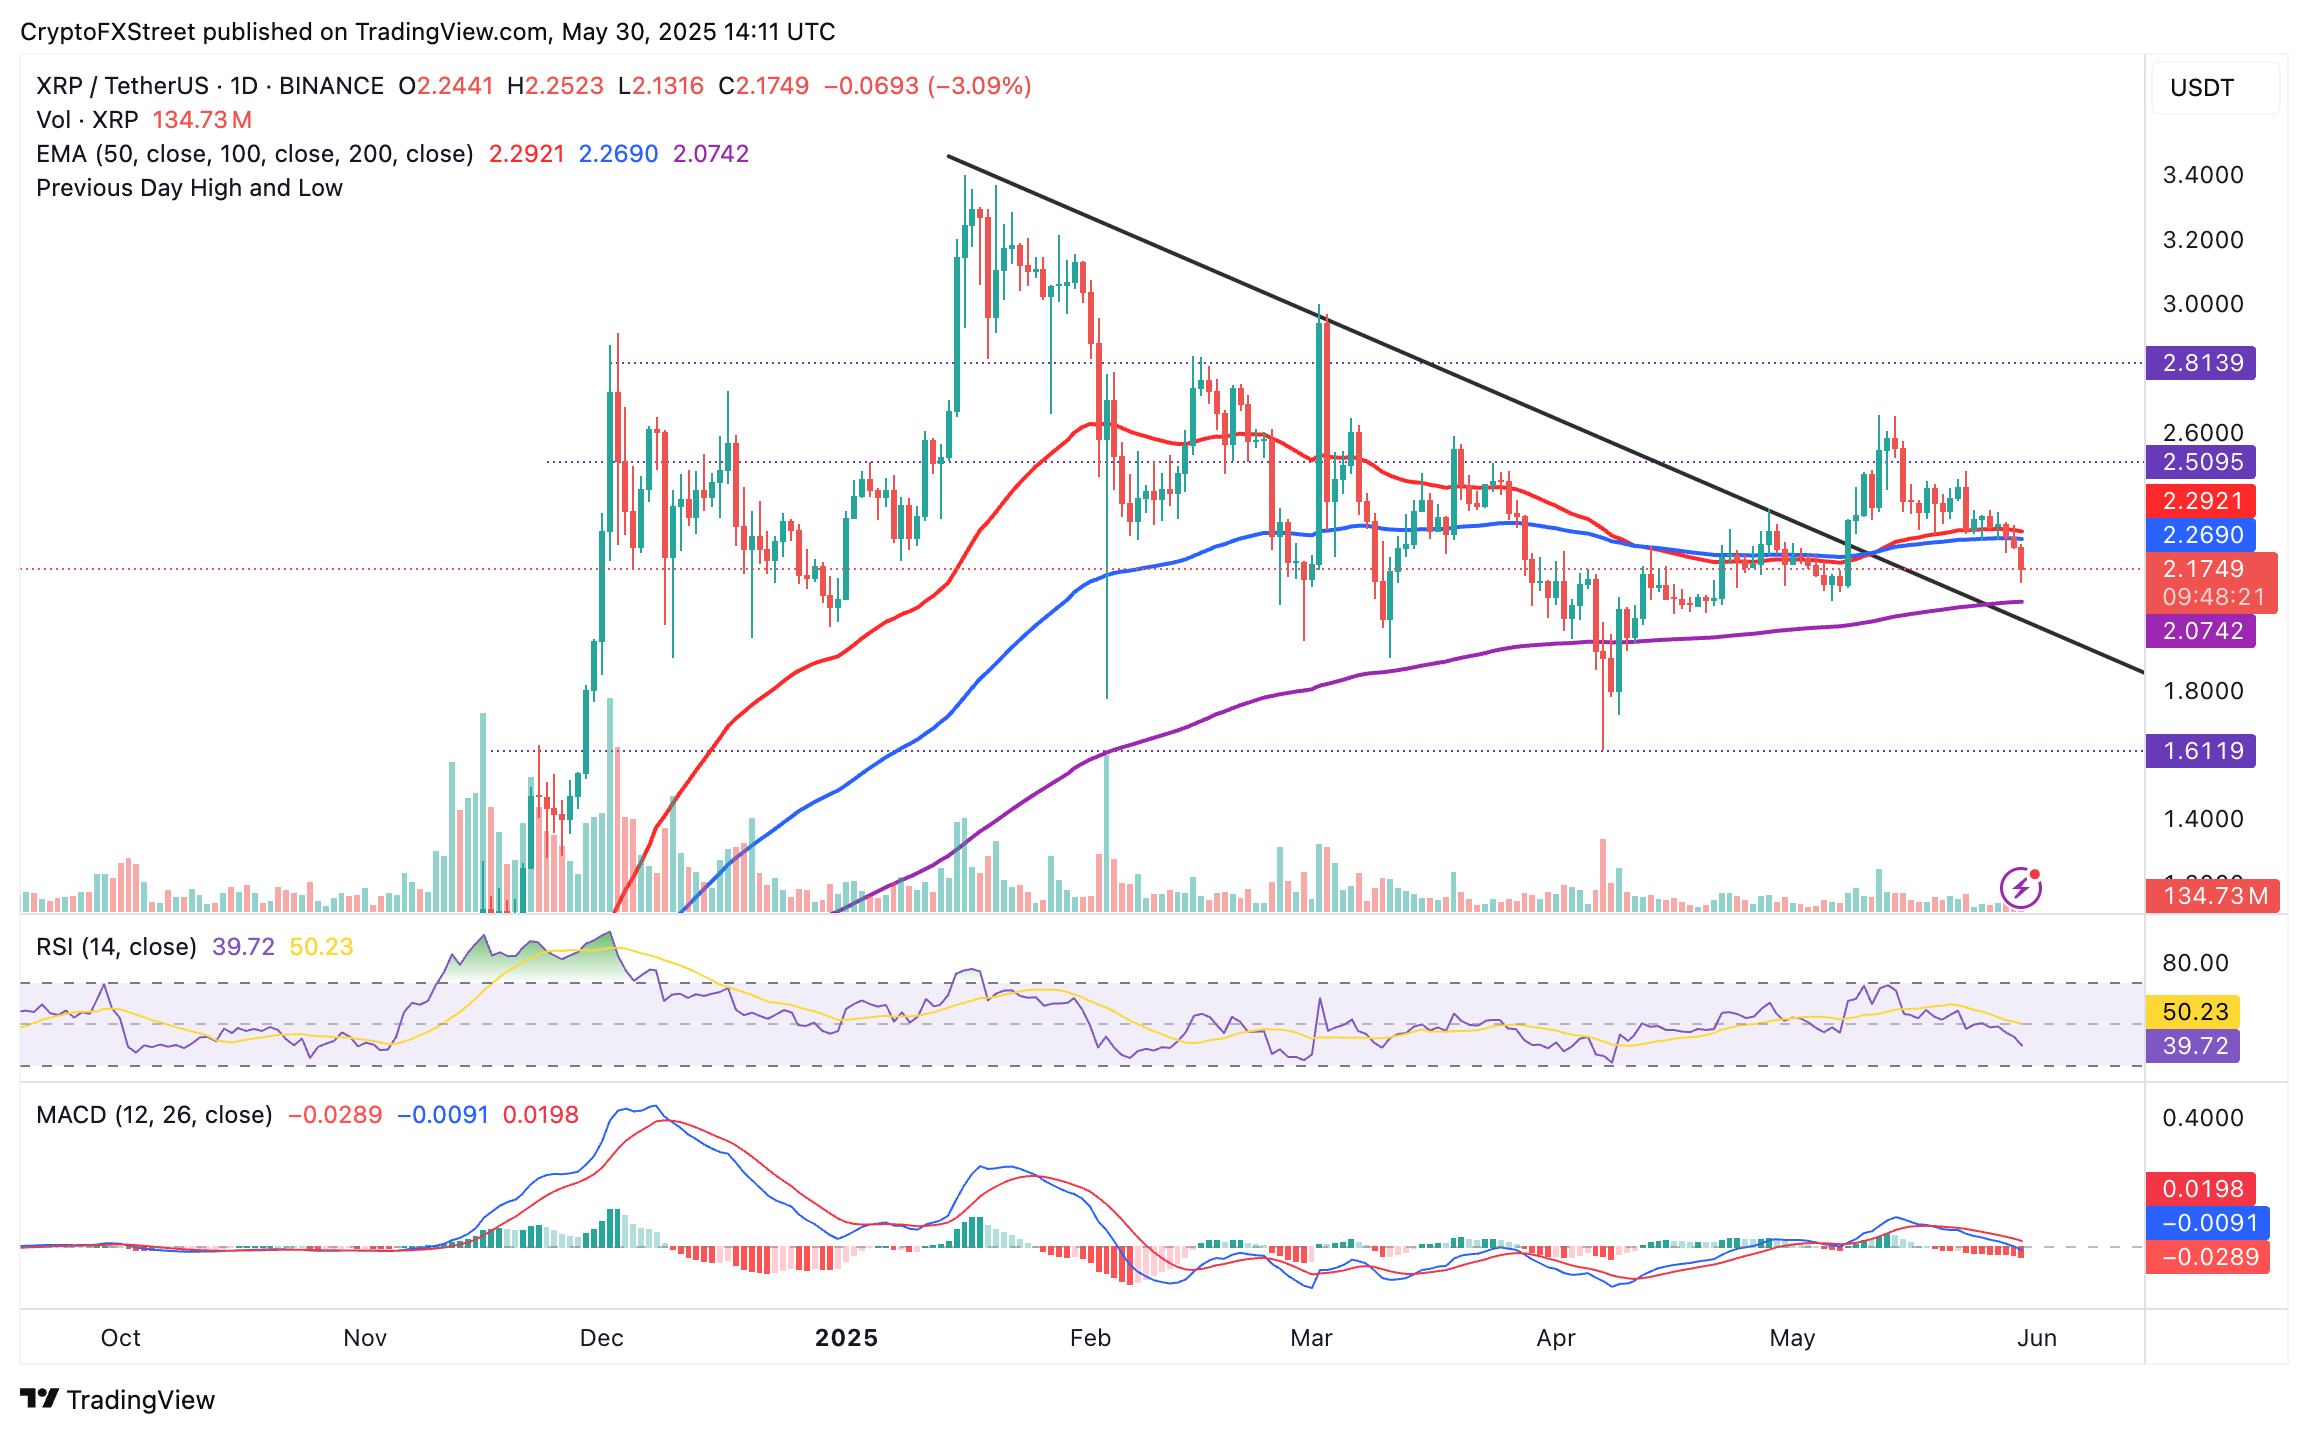
XRP/USDT daily chart
Key areas of interest to traders include the 200-day Exponential Moving Average (EMA), which is likely to offer support at around $2.07, the demand zone at $1.80 and the lowest point in April at $1.61. On the upside, the 100-day and 50-day EMAs sit above the XRP price, acting as resistance levels at $2.26 and $2.29. A trend reversal would bring the recently tested highs of $2.65 and the $3.00 psychological level into focus.